
Performance analysis answers the question: “Will the system meet latency, throughput, and efficiency goals under real workloads?” VisualSim models every stage of data flow — from buffering to computation to interconnects — to identify bottlenecks early.
Latency
Response time from input to output
Throughput
Maximum transactions or packets processed per unit time
Buffer Usage
Avoiding overflow/underflow in data paths
Quality-of-Service (QoS)
Priority handling for critical tasks
Efficiency
Utilization of compute, memory, and interconnects
Cache/Memory Hit Ratios
Locality and stall penalties
Bandwidth Distribution
Detect oversubscribed or underutilized channels

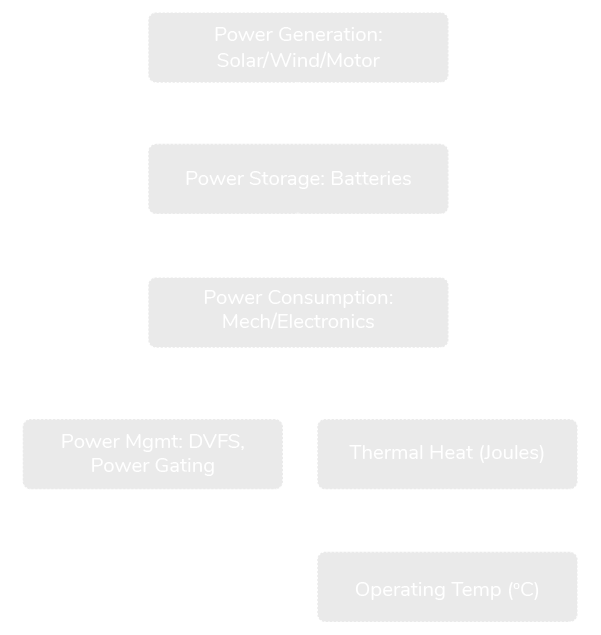
Power is often the limiting factor in system design. VisualSim goes beyond consumption by modeling the entire power lifecycle: how energy is generated, stored, consumed, managed, and dissipated as heat.
Wind, solar, motors, trace, and grid supply
Battery capacity, lifecycle degradation, and stress factors
Mechanical, electrical, and electronic loads
DVFS, power gating, and system shutdown policies
Continuous tracking of heat (joules) and temperature (°C)
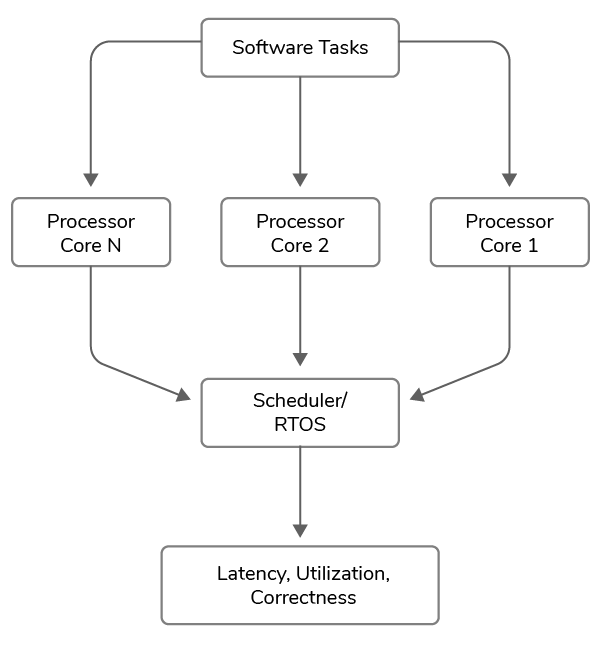
Software often defines system responsiveness and reliability. VisualSim integrates software with hardware to analyze how code execution affects performance.
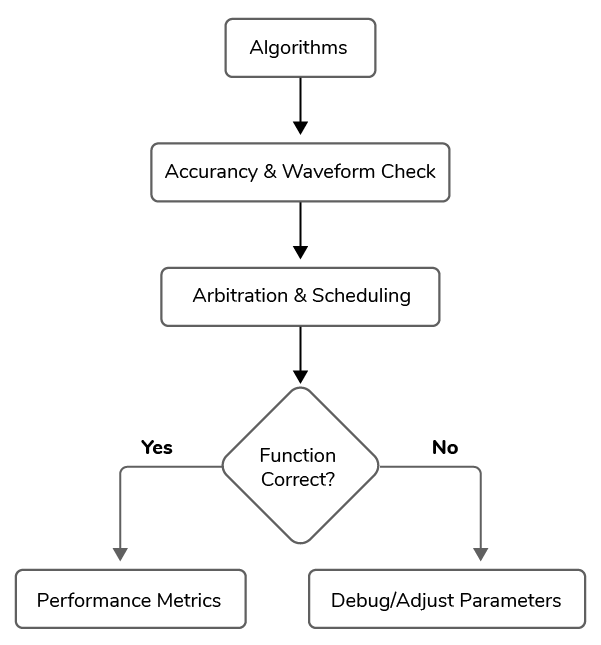
Functional analysis validates that “the system is doing the right thing, the right way.” This includes algorithm correctness, arbitration fairness, and behavior under varied conditions.
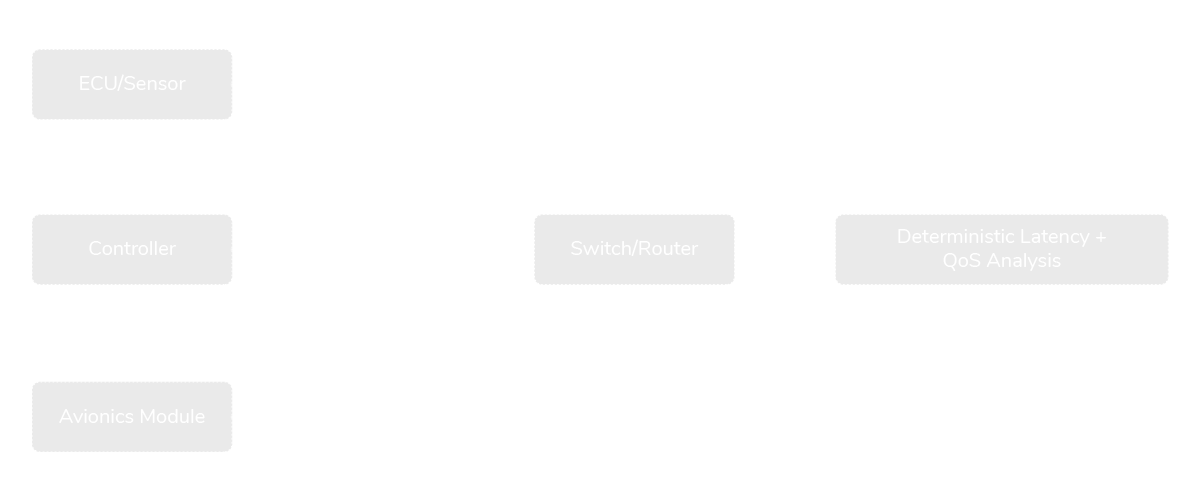
For automotive, aerospace, industrial, and cloud systems, networks are the glue. VisualSim supports major protocols and checks if communication meets deterministic and performance requirements.
TSN, TTE, FlexRay, CAN, CAN-FD, CAN-XL, Spacewire
Deterministic timing for safety-critical systems
Priority handling across traffic classes
Maximum load before degradation
Constant latency for ADAS, avionics, and defense
Failure analysis ensures that systems remain safe, reliable, and standards-compliant even under fault conditions. VisualSim enables the modeling of dynamic failure events across hardware, software, networks, RTOS/schedulers, and semiconductors, allowing architects to quantify the impact, overhead, and recovery strategies.
Functional Safety
Validate compliance with ISO 26262 (automotive), DO-178C (software), and DO-254 (hardware)
Failure Event Injection
Model partial and full failures across processors, memory, interconnects, and network links
Overhead of Detection
Quantify latency, compute, and energy cost of failure monitoring mechanisms
Software & RTOS Resilience
Measure redundancy task activation, schedule corruption recovery, and watchdog performance
Network Reliability
Analyze deterministic recovery under TSN, FlexRay, CAN-XL, or TTEthernet faults
Impact Assessment
Track throughput, latency, and power under fault conditions to evaluate service degradation
Resolution Strategies
Compare fail-silent, fail-operational, and reconfiguration approaches for safety-critical systems
Outcome: VisualSim ensures that systems are not only optimized for performance and power but also robust against faults, delivering confidence to industries where failure is not an option.
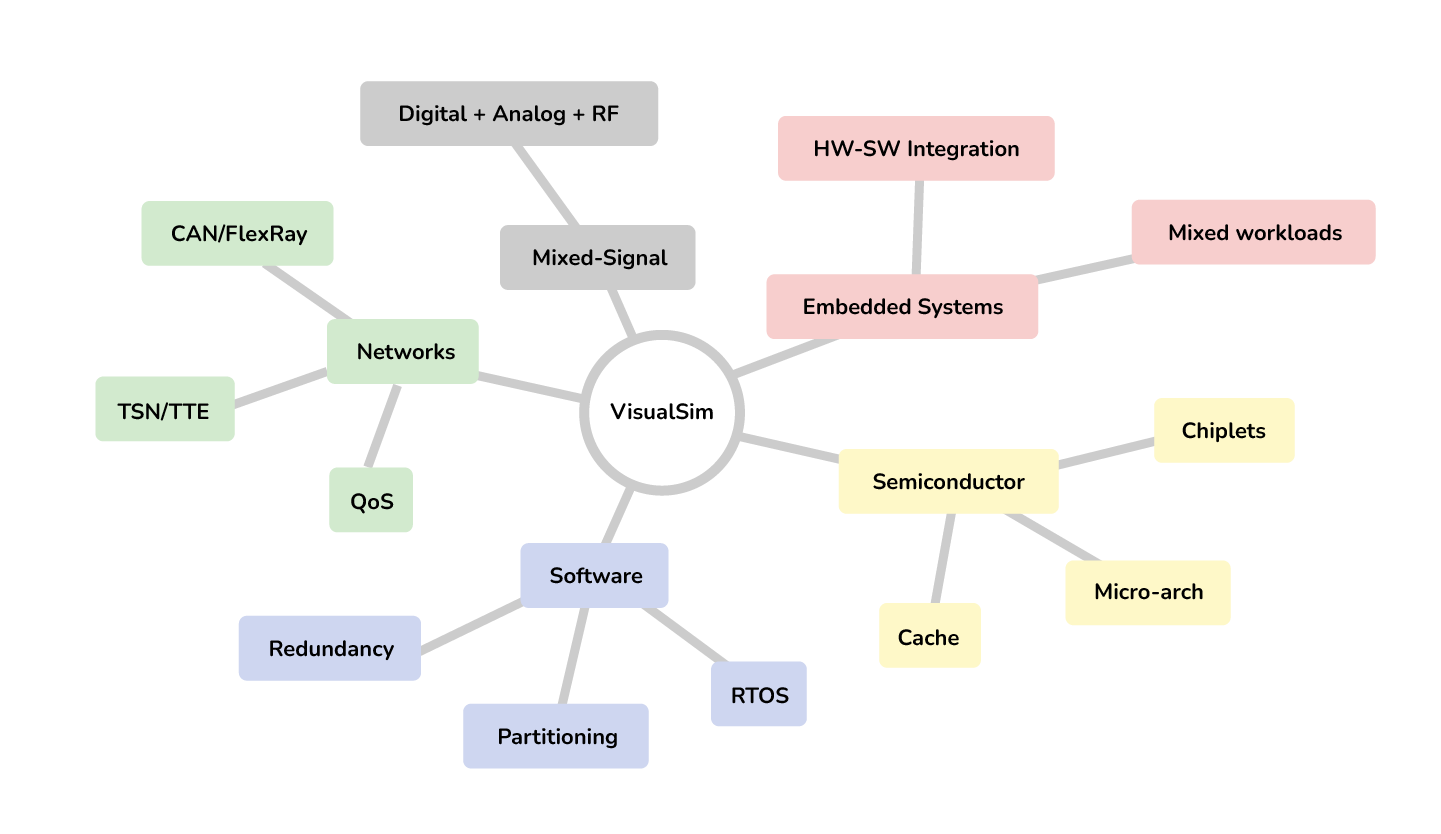
Semiconductor analysis at micro-architecture and chiplet level
Embedded systems design with real workloads
Software correctness and reliability testing
Network QoS and deterministic latency validation
Cross-domain coverage: digital + analog + RF
Avoids 3-month slips → $50M+ market opportunity protected.
Right-sizing saves $100M+ in avoided hardware purchases.
Optimized power management saves $3–5M annually per data center.
Prevented failures avoid penalties worth $50M.
Sustained 75–80% ensures faster ROI and higher profitability.
Semiconductors
SoC design with ARM + RISC-V clusters, cache hit ratios, and power gating. Outcome: avoided re-spin costs.
Automotive
ADAS sensor fusion on multicore with TSN. Outcome: <50ms latency, 12% lower ECU BoM cost.
Aerospace & Defense
Rad-hard CPUs with CAN-FD and redundant schedulers. Outcome: 40% lower mission failure risk.
HPC
GPU-X86-CXL clusters. Outcome: rack utilization improved from 65% → 82%, millions saved in electricity.


