The VisualSim Power Modeling Toolkit delivers highly accurate, system-level power analysis by simulating real component activity, not relying on simplified analytical equations.

VisualSim Power simulates the full power ecosystem — generation, storage, management, consumption, and thermal— across semiconductors, IoT devices, automotive, aerospace platforms, and AI data centers. Power modeling is integrated into every resource, hardware and network component in VisualSim.

As s single model integrates power, performance and functionality, VisualSim precisely captures dynamic state changes, transient between states, and management state machines. Engineers can explore power-performance trade-offs early in design, evaluate failures, voltage jitters, and battery stress under shock conditions, develop advanced management techniques such as DVFS, power gating, and plan for precise cooling.

Power System Modeling Components

1. Power Generation

Sources: solar, wind, motors, grid. Key parameters: generator capacity, variability curves, conversion efficiency.

2. Power Storage

Models: Li-ion, solid-state, supercapacitors. Parameters: capacity, state-of-charge, recharge efficiency, lifecycle degradation.

3. Power Consumption

Loads: mechanical, electrical, electronic (CPUs, GPUs, memory). Parameters: power states, transition costs, per-task energy cost.

4. Power Management

Features: DVFS, power gating, shutdown, redundancy control.

5. Thermal Management

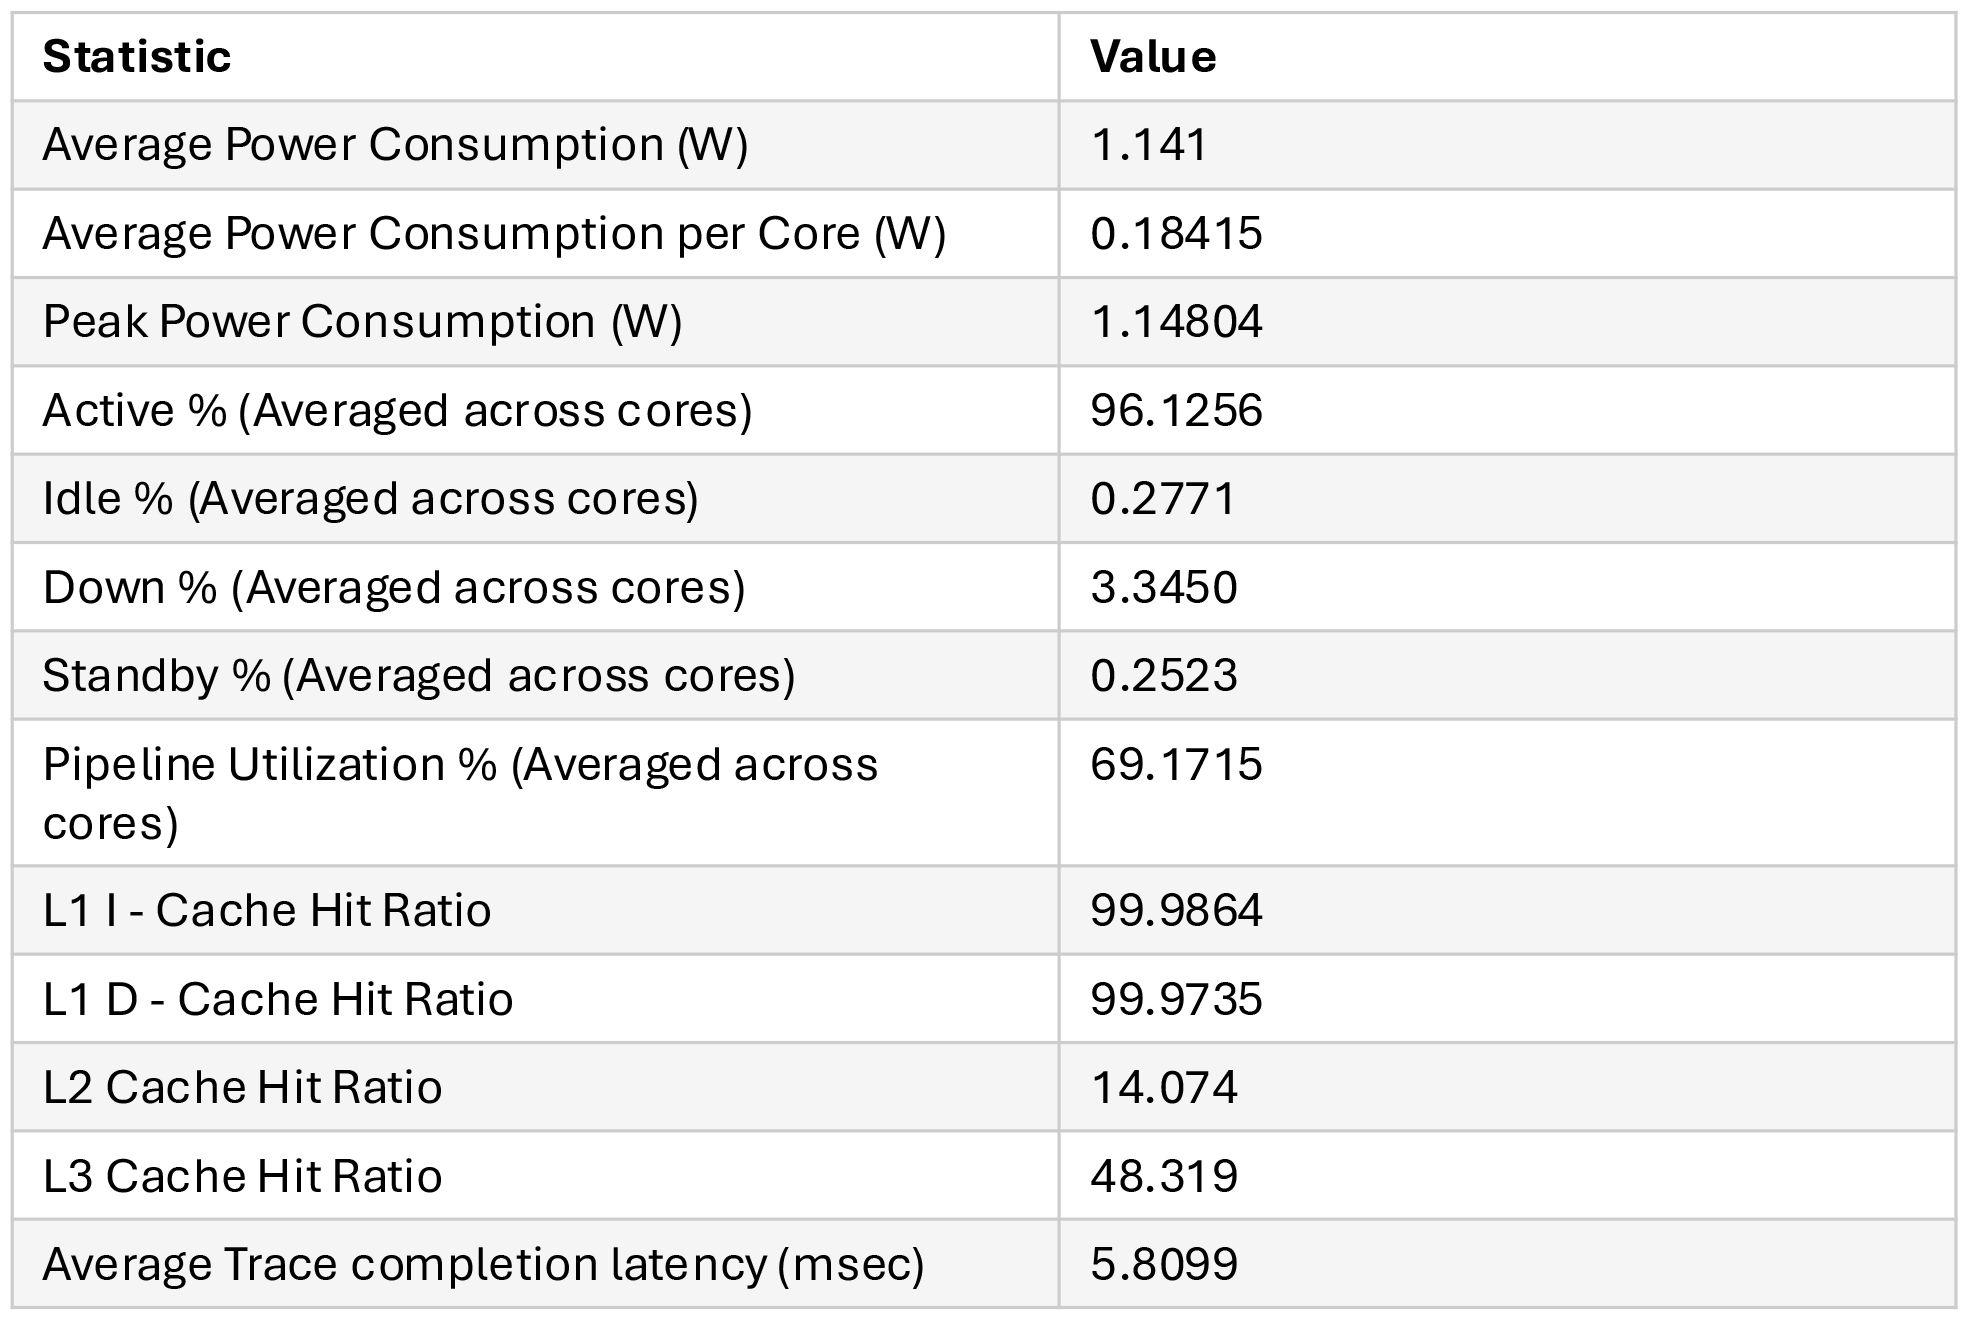
Tracks Joules/sec per subsystem, ambient profiles, cooling methods, and system temperature.

Supported Standards & Features

  • IEEE 1801 (UPF) power intent concepts
  • IEEE 2416 format

Downstream Integration

  • Generate UPF format with power domains and associated voltage levels
  • Generate SystemVerilog power testbench
  • Generate powerState change VCD dump

Power Management​

How VisualSim Power Modeling Works

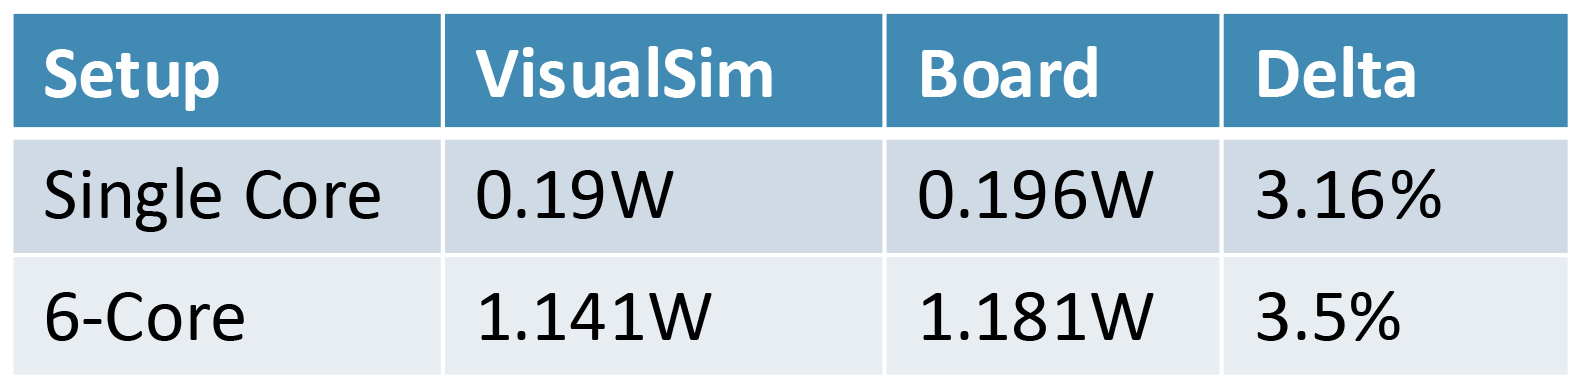
VisualSim delivers accurate power estimates by modeling full system architecture and runtime behavior—rather than relying on static equations or spreadsheet activity factors.

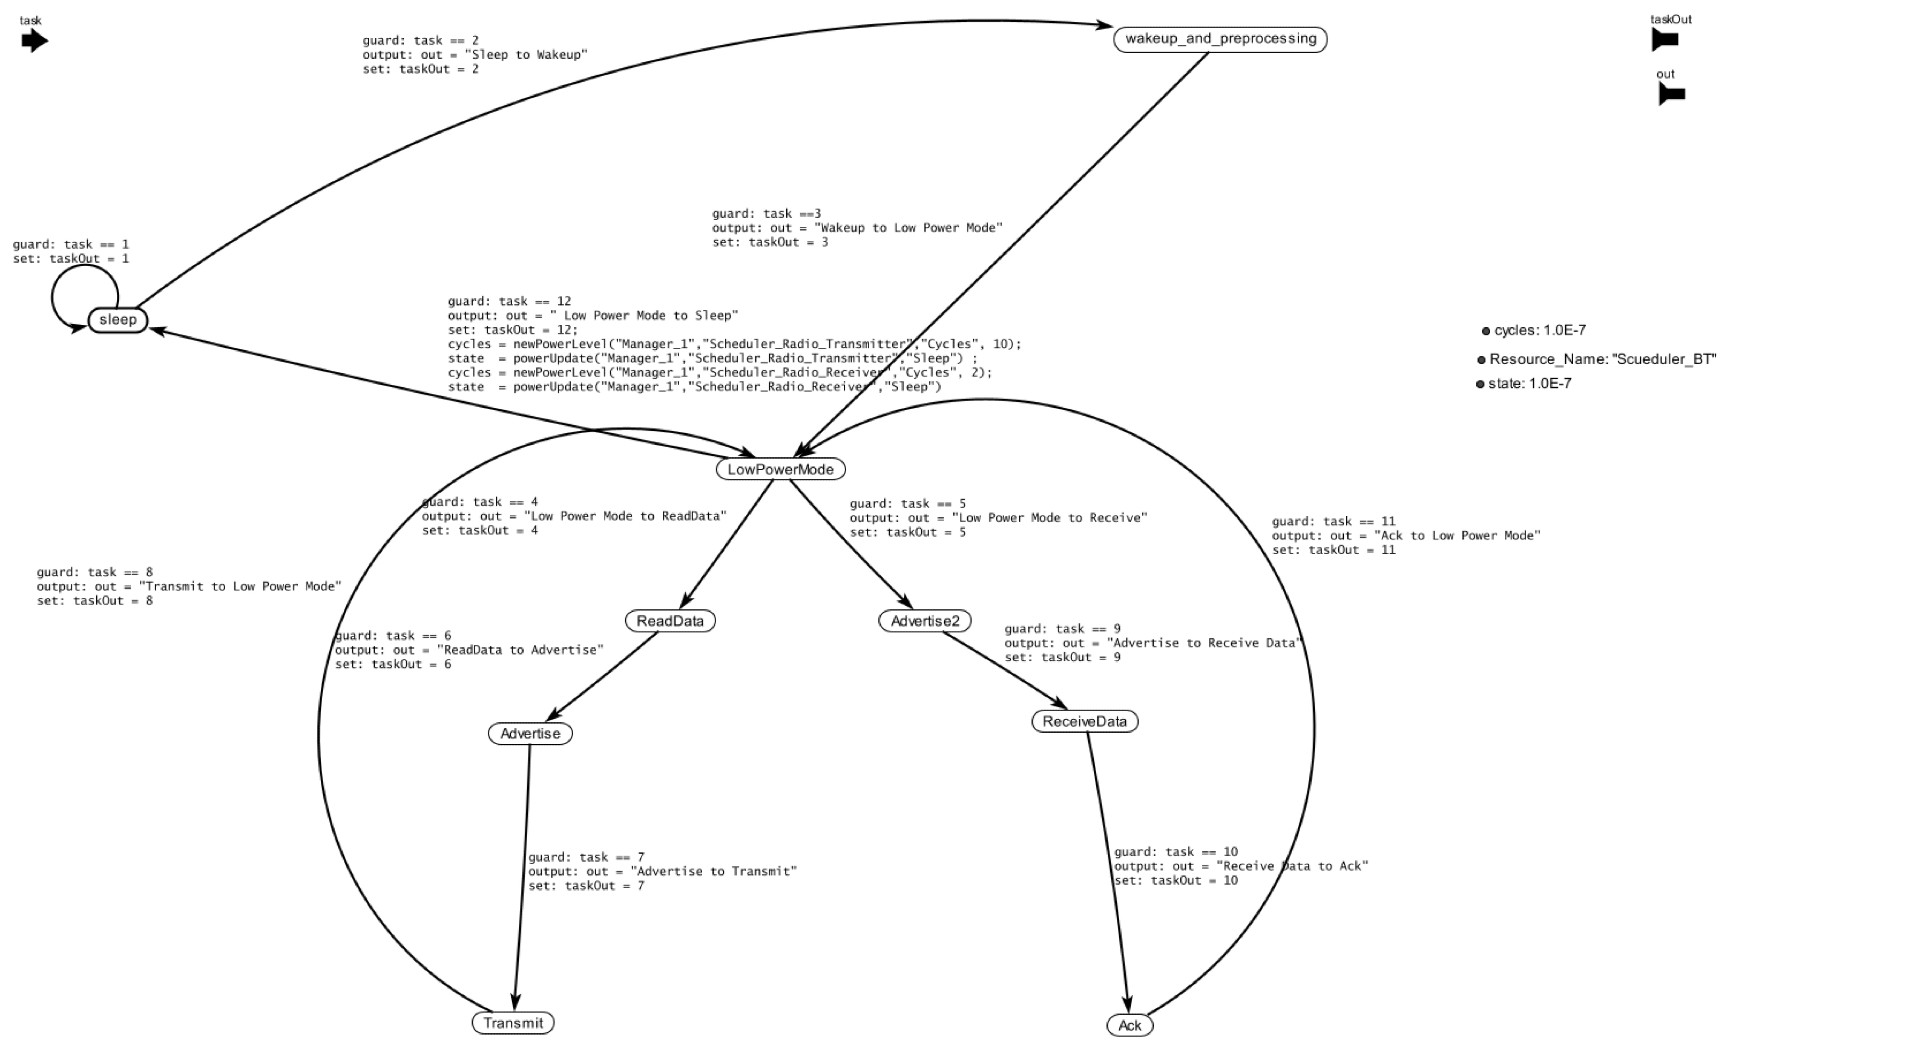
Every component (processor, memory, interconnect, power amplifier, antenna, cable and network interface) shifts between states—active, idle, sleep, or wait etc—triggered by real events such as software task, interrupt, external data movement, DMA operation or network activity. The power for each state, transition between the states and the time before transition can be accessed from a Table or from an external Solver.

This produces a time-accurate power activity tied to the proposed workloads. Power becomes an emergent outcome of complete system behavior, not a separate calculation.

1

Power Management

  • 4 Types of Power Generators in VisualSim
  • Constant, variable, motor, solar charge
  • Charge sent to battery
2

Power Storage

  • Different charging schemes
  • Impact of surge and shocks
  • Battery Lifecycle
  • Battery Consumption
  • Statistics
3

Power Consumption

  • State based power consumption of electronics (controller, SOC), electrical (amplifiers, drivers) and Mechanical (brakes, hydraulics).
4

Power Management

  • Change in power state controlled by time, utilization or expected activity
5

Thermal Management

  • Heat and temperature report
  • Impact of cooling strategy, material etc.
6

Verification and Debugging

  • Explore power-management and power-generation strategies using detailed consumption and software-driven effects (spikes, thermal shocks, DVFS transitions).
  • Verify power-domain behavior by generating UPF descriptions, SystemVerilog power testbenches, and power-state VCD dumps.
  • Evaluate software-application power impact and timing of voltage/frequency transitions.

Why VisualSim Achieves 98% Accuracy

Activity-Coupled Modeling

Power is computed from actual workloads and task activity, not from statistical assumptions.

Cycle-Accurate Timing

Each component’s power is tied to accurate timing of transactions, memory accesses, and clock cycles.

Dynamic Interaction of Subsystems

The framework tracks voltage droops, jitter, and temperature rise caused by activity spikes and load changes.

Realistic Environmental Effects

The system simulates thermal feedback, battery degradation, generator response, and shock-induced stress, which analytical models ignore.

Cross-Domain Integration

Power, performance, and functional behavior are evaluated together, ensuring consistency across domains.

Continuous Validation

VisualSim’s IP libraries are verified against lab data, timing diagrams, and silicon measurements to maintain accuracy across technology generations.


Case Studies

Semiconductor SoC Power Optimization

  • Challenge: Meet battery targets under mixed idle and inference workloads
  • Approach: Modeled CPU/GPU/NPU states, DVFS, power gating
  • Outcome: Idle leakage ↓ 35%, inference energy ↓ 22%

IoT Device Power Management

  • Challenge: Wi-Fi/Bluetooth concurrency and audio DSP spikes drained batteries
  • Approach: Duty-cycle radio scheduling, audio modeling, PMIC rail planning
  • Outcome: Daily power use ↓ 18%, battery life ↑ from 22 to 29 hrs

Satellite Payload Scheduling

  • Challenge: Overlapping payload peaks exceeded bus power
  • Approach: Modeled payload activation, staggered scheduling
  • Outcome: 20% more payloads supported on same bus budget

HPC Data Center Energy Efficiency

  • Challenge: $50M+ energy bill, poor rack utilization
  • Approach: Modeled GPU racks, DVFS, workload scheduling
  • Outcome: Utilization ↑ 82%, $5M/yr electricity savings

Subscribe