
AI data centers are being built to run larger and larger LLM workloads. These workloads do not stay inside one processor or one GPU. They move across CPUs, GPUs, XPUs, HBM, DDR5, storage, and high-speed interconnects.
This makes the interconnect one of the most important architecture decisions.
UALink is used to connect AI processors inside the data center. The question is not just whether UALink is fast. The real question is what the configuration should be for a specific LLM workload.
How many processors should be connected?
How much bandwidth is required?
Where will congestion occur?
How much power will be consumed?
Will the system complete the workload faster, or will it just create more heat and cost?
These questions cannot be answered using only a data sheet.
The Problem: There Is No Simple LLM Benchmark for This
For an application like ChatGPT, it is very hard to find a benchmark that shows how the workload behaves across a full data center architecture. Most benchmarks focus on GPU performance or model execution. They do not always show what happens to the full system when data moves across processors, memory, interconnects, and racks.
That is the problem VisualSim is solving.
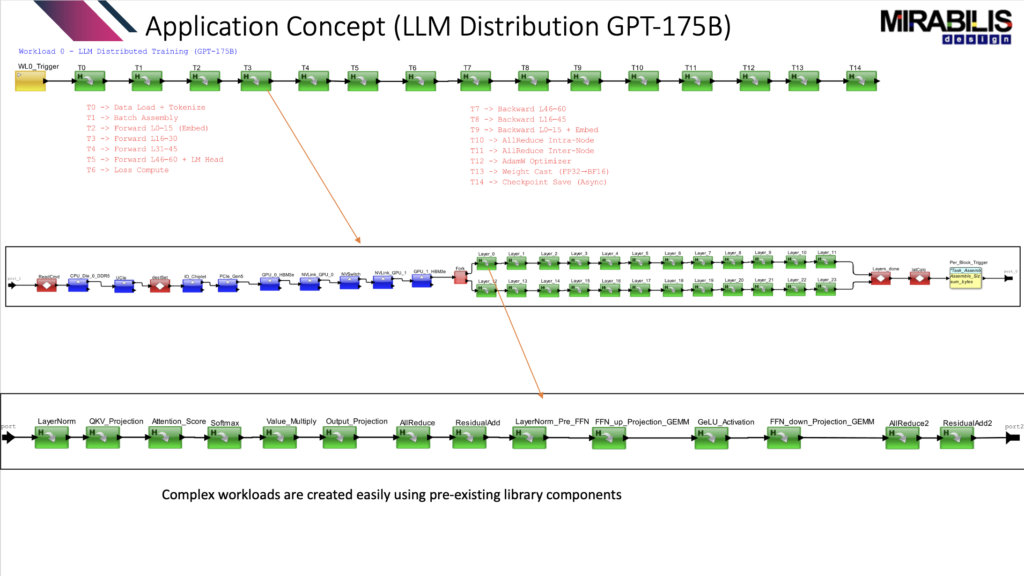
Instead of waiting for a full hardware setup or relying on assumptions, a GPT-style task graph was created to represent an LLM workload. This task graph gives the model a practical way to represent the movement of data, compute tasks, memory access, communication, synchronization, and system activity.
The goal is to test the system before it is built.
What Was Modeled
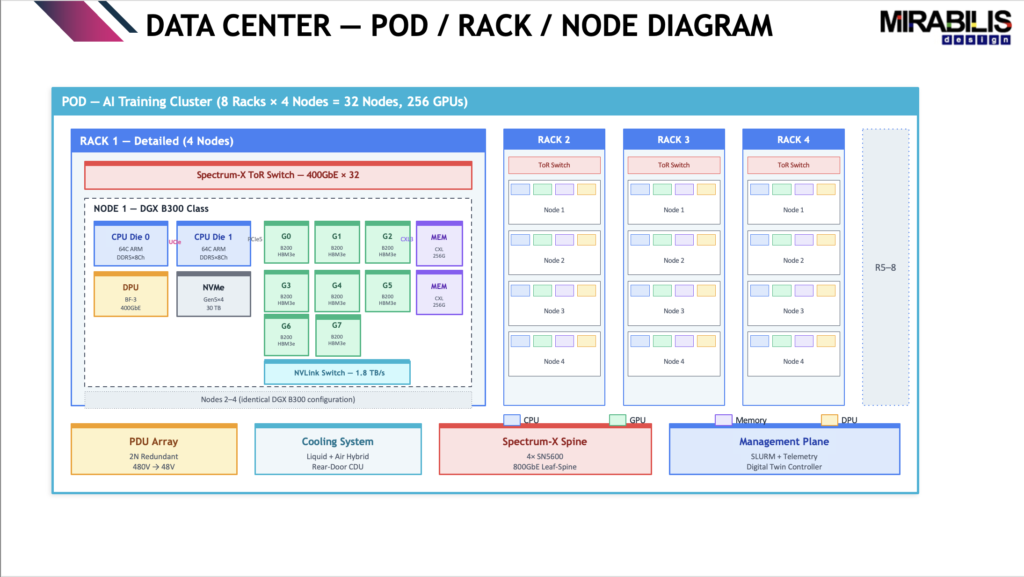
Using VisualSim Architect, the workload was simulated on a large AI data center model. The model included 128 B200 GPUs across 16 nodes and 4 racks. The workload represented a GPT-175B training workload.
Three configurations were studied:
- Baseline using NVLink + NVSwitch with a 256 MB full batch
- Micro-batch using 10 smaller batches of 25.6 MB each
- PCIe host-mediated transfer using DDR5 bounce with a 256 MB full batch
The purpose was to understand how different data movement choices affect latency, power, energy, and system behavior.
This same method can be used to evaluate UALink configurations and find the best specification for an AI data center.
What the Results Showed
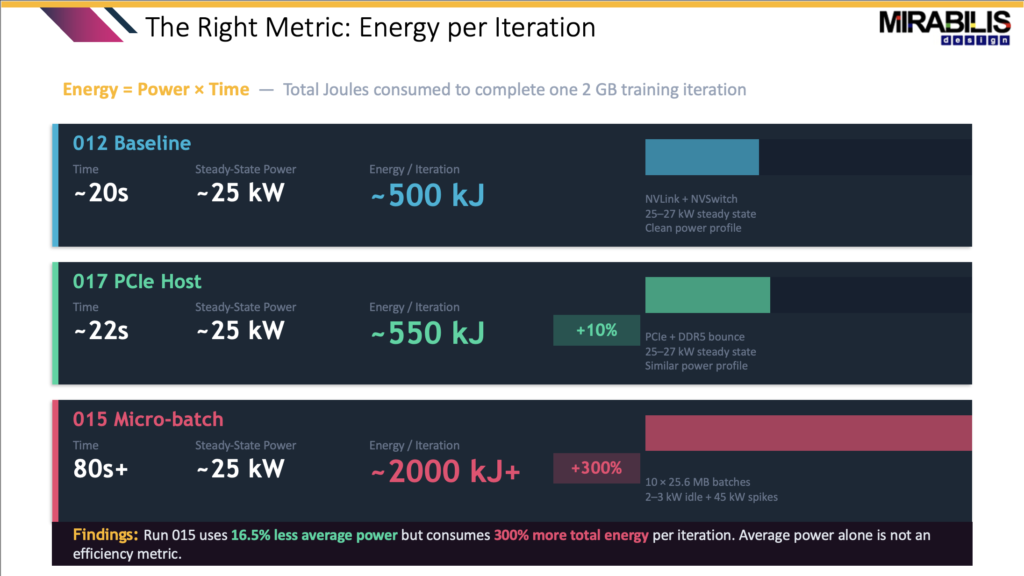
The study showed that the best architecture is not always obvious from average numbers.
For example, the micro-batch configuration looked good at first because the average power was lower. The average power was 19.1 kW compared to 22.9 kW for the baseline. That looks like a 16.5% power saving.
But the time-series results told a different story.
The baseline completed the iteration in about 20 seconds. The micro-batch run was still running after 80 seconds. It also created recurring 45 kW power spikes. The energy per iteration went from about 500 kJ in the baseline to over 2000 kJ in the micro-batch case.
So even though the average power looked better, the total energy was much worse.
This is why VisualSim is important. It shows what happens over time, not just what the average number says.
Why Average Power Is Not Enough
In data centers, power delivery and cooling systems must be designed for peak behavior, not only average behavior.
The baseline had a clean power profile. It stayed around 25–27 kW and completed quickly. The PCIe host-mediated case had a single spike around 42 kW and completed in about 22 seconds. The micro-batch case reached about 45 kW repeatedly and took more than 80 seconds.
This changes the design decision.
If a team only looks at average power, micro-batching may look efficient. But when completion time, peak power, and energy per iteration are included, it becomes the worst option in the study.
For data center planning, this matters because the PDU, UPS, cooling loop, and power delivery system must handle the real peak load.
The Interconnect Decision Matters
The PCIe host-mediated path also showed why the interconnect choice is critical. Replacing the direct GPU-to-GPU path with PCIe and DDR5 bounce created major latency penalties.
The PCIe delay increased from around 2 ms to a worst-case delay of 131 ms. The CPU DDR5 average delay increased from 0.06 ms to 20 ms. That is a huge difference for a workload that depends on fast data movement.
This proves that the architecture cannot be selected only by looking at one component. The full path matters.
For UALink exploration, the same idea applies. The system must be tested with the actual workload movement, data sizes, memory behavior, and synchronization points. Otherwise, the configuration may look strong on paper but fail under real workload pressure.
What VisualSim Gives the Architect
VisualSim Architect gives teams a way to create a digital twin of the AI data center and test these choices early.
The architect can change the workload size, interconnect configuration, memory path, number of nodes, number of racks, and task mapping. Then VisualSim can show the effect on latency, congestion, power, heat, utilization, and energy.
This helps answer the real architecture questions:
Which configuration completes the workload fastest?
Which one has the lowest energy per iteration?
Which one creates power spikes?
Which one causes memory or interconnect congestion?
Which one underuses expensive hardware?
Which one gives the best balance of performance, power, and cost?
These are the questions that matter before selecting a UALink configuration.
The Main Takeaway
For LLM workloads, the best architecture cannot be selected from bandwidth alone.
The VisualSim study showed that average power can be misleading, PCIe host-mediated transfers can create large latency penalties, and the cleanest architecture is the one that balances completion time, energy, peak power, and stability.
For UALink-based AI data centers, this means the configuration should be selected by simulating the workload, not by guessing.
VisualSim helps teams do that. It gives architects a way to test GPT-style workloads across CPUs, GPUs, XPUs, memory, and interconnects before hardware is finalized.
The result is a better design decision.
Instead of asking, “Which interconnect is fastest?” the better question is:
Which configuration gives the best workload performance with the lowest energy, lowest risk, and cleanest power profile?
That is the value of VisualSim architecture exploration.


