VisualSim Power Modeling Toolkit 2.0
VisualSim Power Modeling 2.0 is a dynamic power exploration, optimization and measurement of the Intellectual Property, Semiconductor Device, embedded system, chassis or Data Center. Using this solution, designers and Power Architects can study ways to reduce power consumption, measure power consumed for a software application, impact of hardware configurations, adding new hardware, change interconnects, and new workloads/ use-cases. As the Power modeling reference design from IP vendors is the same platform as the system deployment, it is possible for suppliers and the system integrators to share encrypted power information along with the model.
VisualSim system-level Power Modeling is used during the specification phase and before development. It is possible to optimize the architecture and achieve Power-Performance-Trade off before development, and reuse the same model for downstream debugging.
The built-in-AI engine continuously monitors the power activity to identify failures and the cause of the failure.
How does the VisualSim Power work?
Every VisualSim library block, both standard and custom, has delays associated with each activity. The activity can be processor execution unit compute, HW acceleration, pipeline stage, power switching time or memory access. Delay is the time taken to conduct an operation and is dynamic based on the use case, data size, etc. For example, a processor might be interrupted, and a series of instructions might be executed. A processor might go into Active, Standby, Wait, Idle, Sleep or Deep_Sleep states during, before, or after executing this task. During execution, voltage/frequency might be modified dynamically based on a Power Management Unit (PMU) logic. Each instruction can have a different cycle count and be in a power state.
A delay can be a fixed or dynamic value based on the activity, instruction, data size or data type. Each of these delays are associated with a micro-event which is associated with a power state. These power states are linked to a PowerTable with the same name. As the device, IP, or system moves from one state to another, power measurements get modified. When a device moves from one state to another, there is a transition delay to account for switching, voltage-drop, time to generate a new voltage, etc. A new power device does not start executing until this transition delay has been completed. When a device has been idle for a while, it can move to a lower state using a PMU instruction(s). Similarly, if a device receives multiple requests, it can be moved to a higher voltage or different power state. An Active state can be defined for each task. Encoding/decoding running on a single DSP might have different Active states listed. Transition times between two states will be a unique value.
List of library components
- Power table for user-input, data handling and collecting statistics.
- RegEx functions to integrate the power activity into the architecture components for hardware, software and networks. This is used dynamically change states, define new states on-the-fly and modify voltage level for a state.
- Battery models for NiCd, LiON, Alkaline and over 5 other types
- Energy harvester- Solar, wall socket, motor, Nuclear, Wind and Generic
- Graphical and Textual Statistics Generation- Provides real-time visibility, offline reports and graphical displays
List of VisualSim System-Level IP block integrated into the Power Modeling
- System Modeling- Server and System Resource
- Hardware – Processor, Cache, Memory, Crossbar, DMA, Bus, Switch, FPGA, wire, repeater and custom components
- Standards – PCI, PCIx, PCIe, AHB, APB, AXI, CMN-600, RapidIO, SpaceWire, FibreChannel, Firewire, Ethernet, Audio-Video Bridging and Time-Sensitive Networking
- User-blocks – incorporate power activities using RegEx functions
Difference from existing solutions
Most power solutions capture micro-events from simulators, store them in a file and post process a file to calculate power. Other solutions debug power states in code. Every scenario change requires a separate file. As simulators capturing these events during development or validation use SystemC, RTL, Schematic, chassis or data center level, the time taken to simulate is in matter of days or hours , and the number of scenarios simulated is limited.
This is also a reason many solutions are resorting to AI for predicting the power in other scenarios. AI solutions require a large number of data points and are usually available.
VisualSim is the only solution that interacts directly within a simulator. This means a user can instantly view the impact of lower voltage, change in configuration, dynamic scenarios and different workloads. The simulation of an entire SoC can be less than 5-10 min. A full data center might be simulated in less than 20 min. A user can run 1,000s of scenarios using a regression that distributes across multiple-cores. A requirements tracker uses AI to continuously inspect a simulation to detect any anomalies, like an instant load is too high, or battery charging is below a threshold.
System-level model uses real scenarios and accurately models the behavior and timing of a system. Hence the accuracy of power measurements from a VisualSim System model is very high. Mirabilis Design and their customers have seen accuracy of 95%+ when compared to the physical hardware or silicon.
Details
VisualSim Power Modeling 2.0 is the first solution to enable dynamic power tracing and accurate system-level evaluation of the power consumed by different architectures. Using the Power table, designers can measure the power consumed, experiment with management options like power gating and sleep modes, vary the number of states/process/devices and optimize the specification to meet the threshold. An individual power table can be maintained for each level of hierarchy, than allowing different designers to maintain the power for their device locally. The extended features of the Power Toolkit are to size the battery, select the right battery technology, design the energy harvester, measure the battery life based on activity, cooling requirements and compute savings for different PMU conditions.
Power Table
The power table consists of three parts – power state, power management and units. The power state consists of the list of states and associated power calculation; current active and standby state, transition times and any parameters for this device. The state power expression can contain the area, active switches, leakage, activity, transition, voltage and LDO. The active power can be unique for each task executing in the system.
The power management maintains the time in a particular states, before being transitioned to a lower stage such as standby, sleep and deep sleep. The units of power can be micro, mini or watts.
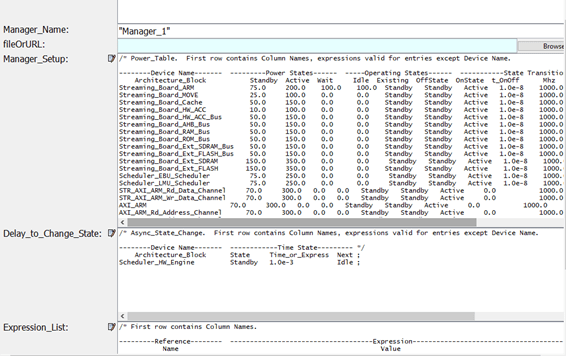
VisualSim Power Setup
.
Battery
The Battery is a standard block in the Power library. This block works in tandem with the Power Table to handle the consumption, charging and discharging from the battery. Battery block is used to perform battery sizing, analyze battery characteristics, battery efficiency, instantaneous and average power consumption. Block parameters are provided to configure the battery for different battery configurations. The block is connected to both the Power Table and the Energy Harvesters. Also, there are additional inputs to emulate shocks and thermal impacts.
Battery Charging
The battery charging can be done in two different ways, Regular Charging and Turbo Charging.
In regular charging mode, the battery will have a fixed duration of time for a full charge. A minimum State of Charge level (SOC) can be set and the battery will not be charged until the state of charge reaches this value. On the other hand, by disabling the CustomCharge parameter, the battery will be charged continuously whenever a charging source is connected. When Turbo Charging is used the battery charging is done in multiple steps with the State of Charge reaching a specified level. The time that the battery takes to charge up to each step can be different.
Energy Harvester
The Energy Harvester is a standard library block of the Power toolkit and provides a convenient way to define the input for the battery charging. The standard harvesters available are constant charge, vary with time, trace from an existing system, nuclear, solar, wind and motor. This is connected to the input to the Battery. This block generates the charge based on the settings for the selected harvester.
Statistics
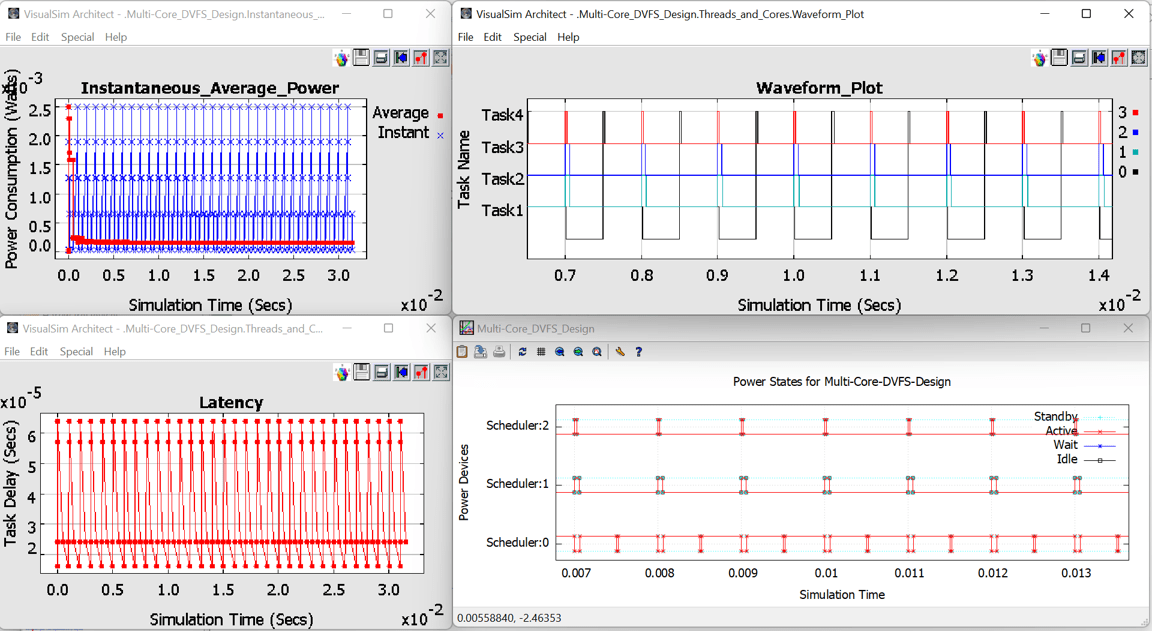
The Power Table maintains a very detailed trace of the power activity. This allows a large variety of reports that are automatically generated for the full system or by device, IP or hierarchical level and sub-system. The data is also used to generate the output in UPF format.
- The timing diagram of the power consumption by state and per device
- Current, average and cumulative power by device, by sub-system and total for the entire system
- State change and average real-time plot
- Energy Harvester usage rate
- Input Charge vs. Charge Accepted
- Instantaneous Power Consumption
- Available Battery Capacity
- Battery Life Remaining Percentage
- Surge Details
- Full charge Capacity vs. Designed Capacity
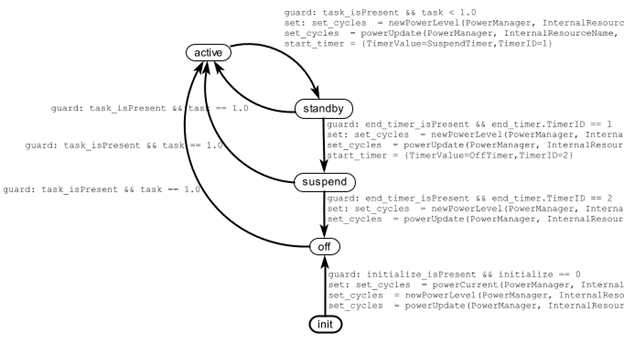
RegEx
There is a RegEx function to get access to the Power Table internals and change the state or power value for a listed device.
Dynamic power effects
One of the advantages of an interactive power study is to view impacts of different power management strategies. Some of these strategies can be to reduce the power. But most times it can be to balance performance or even maximize performance. For those using laptops, you will see that the frequency is normally about 1.8Ghz but can jump to 5.2Ghz when there is a large simulation executing on the laptop.
- Link the clock speed to a power/voltage value. Link these variables to a state equation or script/FSM.
- Track utilization and buffer usage to modify power levels.
- Track Heat and Temperature using Temperature library block.
- Track battery activity using Battery library block.
- Impact on battery such as low power range, lifecycle, shock etc.
- Manage charging and track battery capacity over time.
- Generate power from different power generator sources for the system and mission.