Abstract
According to Intel, hyper-threading at two threads per core implementation used only 5% more die area than a comparable non-hyper-threaded processor core with one thread per core, while performance was 15–30% better. Hindsight suggests that hyper-threading is simply a workaround, as processor manufacturer’s had difficulty widening the path to a greater number of Execution Units (EUs). As most processor dies have sub-memories, this 5% constituents a much larger portion of a processors logic space. These models do not have detailed processor logic, as the Execution Units (EUs) determine thread completion, including EU queues.
Several system models were created for hyper-threading using VisualSim Architect and compared the number of threads completing for single vs. hyper-thread cores with separate models. A single core was modeled, as it eliminated overhead from other applications and the statistics were more relevant.
The question we are looking to answer is whether hyper-threading is universally better? What is the cause of performance limitations for hyperthreading? Is there a more economical way, i.e. less logic area to gain the same performance? Model conclusions are discussed below.
Hyper-Threading
Hyper-Threading is Intel’s answer to simultaneous multithreading (SMT). Physical cores are split into virtual cores, known as threads. Intel’s CPUs with two cores use hyper-threading to provide four threads, and so on. Hyper-Threading allows each core to do two things simultaneously, increases CPU performance by improving the processor’s efficiency, thereby allowing one to run multiple demanding applications at the same time using heavily-threaded apps without the PC taking longer to complete, at least this is the hypothesis.
Hyper-Threading can improve the performance for some MPI (Multiple Processes per Input) applications, but not all. Depending on the cluster configuration, more importantly, the nature of the application running on the cluster, performance gains can vary or even be negative. To understand the true performance, one needs to execute the threads using simulation tools to understand how an instruction-mix contributes to performance gains or degradation?
Hyper-Threading Architectures
A simulation model provides far more flexibility in experimenting with different configurations and generating relevant statistics. A simulation model must consider processor core, caches, interconnects, memory controller and external DDR DRAM. Models must have sufficient resolution and accuracy to gain confidence in the simulation results.
The simulation model has been visually built to look like a single-core design. The model uses standard IP components in VisualSim, as they have been rigorously tested with a high degree of confidence.
The most significant part of the test is the software that is being executed on a processor core. Rather than using standard benchmark suites, we decided to take an alternate approach. We built an instruction mix based on an instruction mix file, based on a supplied profile. In this way, we can determine what specific sequences can benefit from Hyper-threading. We also added an element of randomization to repeat thread tests, ~1200 times. In this manner, one can have the same profile with slightly different ordering of instruction mnemonics, and enables a more comprehensive randomized test.
Hyper-Threading model, note parameter Hyper_Thread_Flag = true
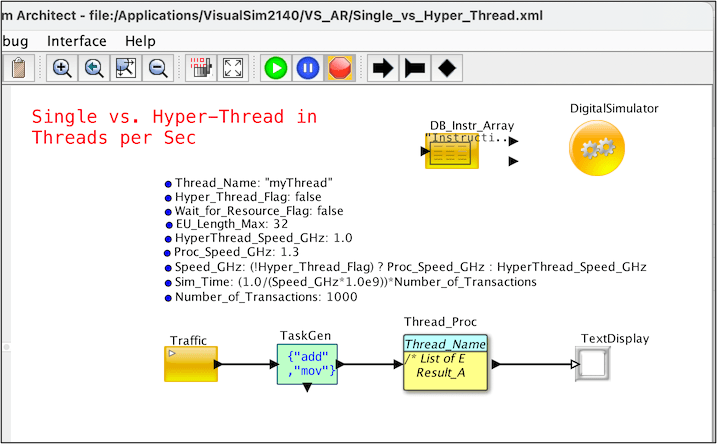 Figure 1 VisualSim Hyper-Thread 1x Mnemonic Model
Hyper_Thread Model
The system-level simulation model in VisualSim Architect has three parts:
- Traffic or interrupts to start software execution
- Generation of the instruction mix to represent the software threads
- Execution Unit sub-unit availability via queues
Top level parameters in a VisualSim model determine model constraints. A Hyper_Thread_Flag determines if the processor functions as a hyper-thread or a single-thread. The Speed_GHz determines the processor clock speed. A few additional parameters were added to emulate alternate configurations that would improve performance. The number of instructions sequence to be sent is also a parameter.
The TaskGen block generates the instruction mix in three parts:
- The associated instructions, referenced by a database block
- Mix of bins as a percentage along with the number of instructions, and
- TaskGen block that create the instruction sequence using the information in the Instruction_Mix_Table file.
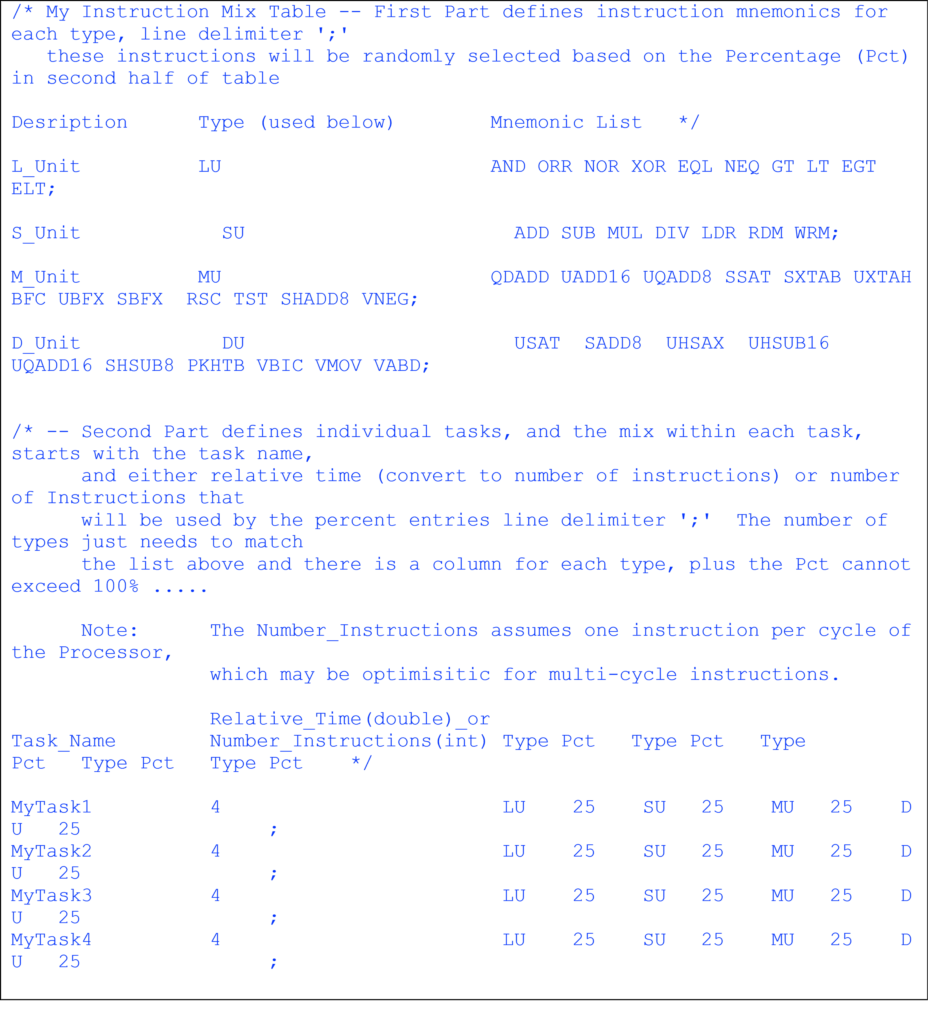 Figure 2 Table describe the mix of Instructions to generate test cases for Processor evaluation
Each instruction is assigned a cycle count. For example, the ADD is 1 cycle while the MUL is 2 cycles and the DIV is 4 cycles in Instruction_Map.txt:
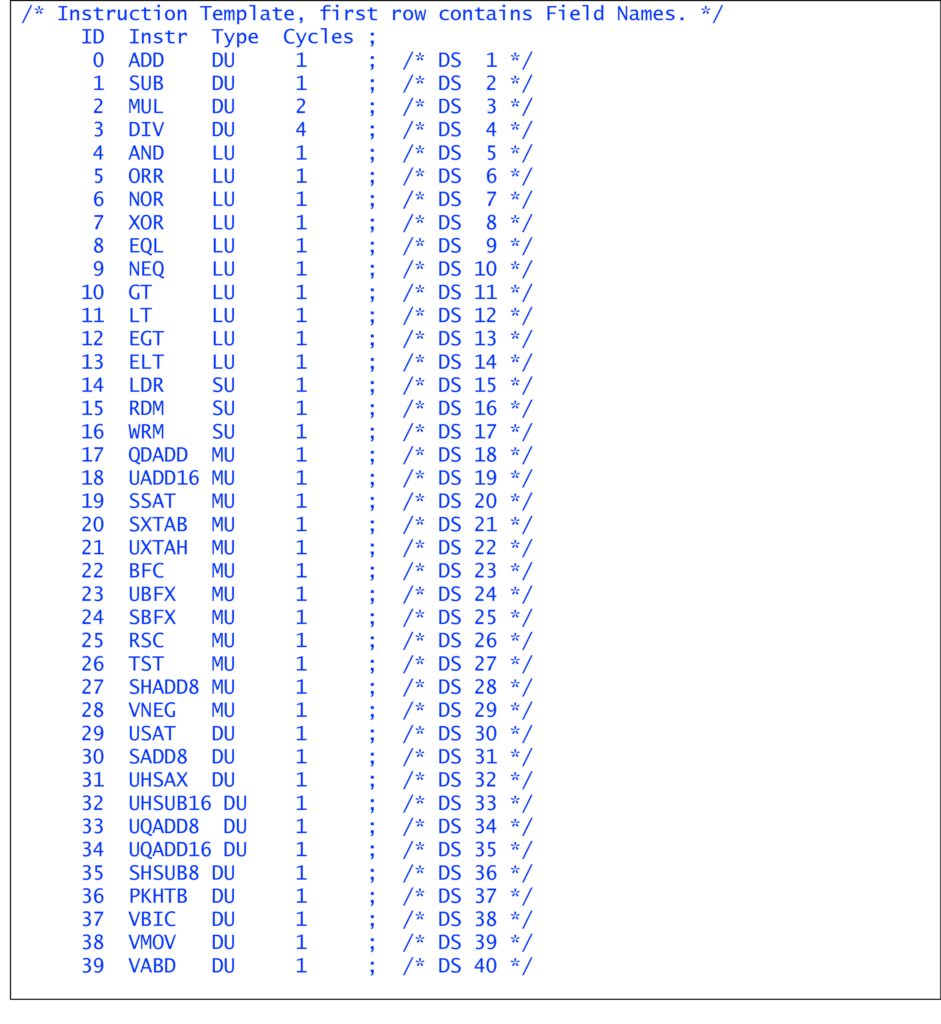 Figure 3 Database listing the Execution Units, associated instructions and cycles
The below instruction map shows a 4x Cycles over the standard list.
 Figure 4 Database of Execution Units and associated instructions
Most mnemonics complete in Nx cycles except a few complex instructions such as MUL and DIV that are 2Nx, 4Nx respectively. N is 1 to 4. Based on the listed cycles per instruction, the claimed performance improvement of 15-30% did not materialize. The model might be missing some processor speed development issues as the longest logical path between clock periods is not addressed in this model. This approach allows one to model either RISC, CISC, or a combination of the two.
Hyper_Thread Model Findings:
Different clock speeds were used based on over the overhead and estimates of a core with or without hyper-threading logic. This is the reason for more tasks per sec for single-core, namely less hyper-thread logic and faster thread processing. A single-thread completes more threads by having less logic per core, no need for hyper-thread logic, hence 30% faster clocks are used in the thread models.
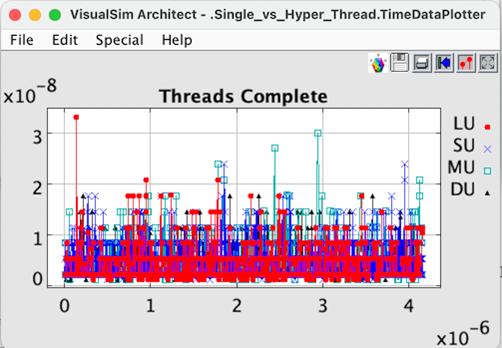 Figure 5 Single Thread per Core completion.
The Hyper_Thread model computes threads per second:
Hyper Thread per Core, note 1.0 ns per cycle at 1.0 GHz clock rate
4.0 (cycles per thread) * 1.0 ns (per cycle) * 1200 (threads) + 1ns (offset) = 4.001 usec // no thread delays 1x instruction mix cycles
The below table shows the statistics for the Execution Units- LU, DU, SU and MU. This is 1x instruction per cycle.
Single_Core Threads per Sec: 2.8888888888889E8
DISPLAY AT TIME —— 4.79700 us ——
{BLOCK = “Single_vs_Hyper_Thread.Thread_Proc.LU”,
DS_NAME = “Queue_Common_Stats”,
ID = 1,
Number_Entered = 1592,
Number_Exited = 1589,
Number_Rejected = 0,
Occupancy_Max = 4.0,
Occupancy_Mean = 1.2869264613451,
Occupancy_Min = 0.0,
Occupancy_StDev = 1.0191497887403,
Queue_Number = 0,
TIME = 4.797E-6,
Total_Delay_Max = 2.4E-8,
Total_Delay_Mean = 5.4389937106919E-9,
Total_Delay_Min = 0.0,
Total_Delay_StDev = 2.6162989834934E-9}
DISPLAY AT TIME —— 4.79700 us ——
{BLOCK = “Single_vs_Hyper_Thread.Thread_Proc.SU”,
DS_NAME = “Queue_Common_Stats”,
ID = 2,
Number_Entered = 810,
Number_Exited = 809,
Number_Rejected = 0,
Occupancy_Max = 4.0,
Occupancy_Mean = 1.0111111111111,
Occupancy_Min = 0.0,
Occupancy_StDev = 0.7988417541342,
Queue_Number = 1,
TIME = 4.797E-6,
Total_Delay_Max = 4.4E-8,
Total_Delay_Mean = 7.9802469135803E-9,
Total_Delay_Min = 0.0,
Total_Delay_StDev = 5.3554730227177E-9}
DISPLAY AT TIME —— 4.79700 us ——
{BLOCK = “Single_vs_Hyper_Thread.Thread_Proc.MU”,
DS_NAME = “Queue_Common_Stats”,
ID = 3,
Number_Entered = 937,
Number_Exited = 933,
Number_Rejected = 0,
Occupancy_Max = 4.0,
Occupancy_Mean = 1.2875467664351,
Occupancy_Min = 0.0,
Occupancy_StDev = 1.019662345381,
Queue_Number = 2,
TIME = 4.797E-6,
Total_Delay_Max = 2.4E-8,
Total_Delay_Mean = 7.6959314775161E-9,
Total_Delay_Min = 0.0,
Total_Delay_StDev = 4.5633354639267E-9}
DISPLAY AT TIME —— 4.79700 us ——
{BLOCK = “Single_vs_Hyper_Thread.Thread_Proc.DU”,
DS_NAME = “Queue_Common_Stats”,
ID = 4,
Number_Entered = 1461,
Number_Exited = 1460,
Number_Rejected = 0,
Occupancy_Max = 3.0,
Occupancy_Mean = 1.1454483230664,
Occupancy_Min = 0.0,
Occupancy_StDev = 0.8378422431869,
Queue_Number = 3,
TIME = 4.797E-6,
Total_Delay_Max = 3.2E-8,
Total_Delay_Mean = 6.4941820670774E-9,
Total_Delay_Min = 0.0,
Total_Delay_StDev = 3.9113377510932E-9}
For the hyper-thread, the delay is 1 ns per instruction or 1.0 GHz clock rate. The below table shows the statistics for the Execution Units- LU, DU, SU and MU. This is 1x instruction per cycle.
DISPLAY AT TIME —— 4.79700 us ——
Hyper_Thread_Flag Threads per Sec: 2.2222222222222E8
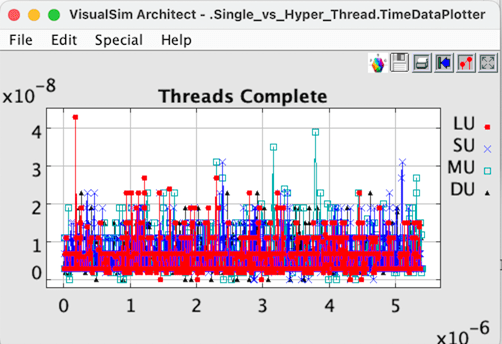 Figure 6 Hyper Thread per Core completion.
Ratio of Clock Speeds (GHz): 1.3 GHz / 1.0GHz = 1.3 Ratio of Threads per Sec : 2.88889E8 / 2.22222E8 = 1.3
EU Stats for EU Queues generated by VisualSim
DISPLAY AT TIME —— 4.79700 us ——
{BLOCK = “Single_vs_Hyper_Thread.Thread_Proc.LU”,
DS_NAME = “Queue_Common_Stats”,
ID = 1,
Number_Entered = 1592,
Number_Exited = 1589,
Number_Rejected = 0,
Occupancy_Max = 4.0,
Occupancy_Mean = 1.2869264613451,
Occupancy_Min = 0.0,
Occupancy_StDev = 1.0191497887403,
Queue_Number = 0,
TIME = 4.797E-6,
Total_Delay_Max = 2.4E-8,
Total_Delay_Mean = 5.4389937106919E-9,
Total_Delay_Min = 0.0,
Total_Delay_StDev = 2.6162989834934E-9}
DISPLAY AT TIME —— 4.79700 us ——
{BLOCK = “Single_vs_Hyper_Thread.Thread_Proc.SU”,
DS_NAME = “Queue_Common_Stats”,
ID = 2,
Number_Entered = 810,
Number_Exited = 809,
Number_Rejected = 0,
Occupancy_Max = 4.0,
Occupancy_Mean = 1.0111111111111,
Occupancy_Min = 0.0,
Occupancy_StDev = 0.7988417541342,
Queue_Number = 1,
TIME = 4.797E-6,
Total_Delay_Max = 4.4E-8,
Total_Delay_Mean = 7.9802469135803E-9,
Total_Delay_Min = 0.0,
Total_Delay_StDev = 5.3554730227177E-9}
DISPLAY AT TIME —— 4.79700 us ——
{BLOCK = “Single_vs_Hyper_Thread.Thread_Proc.MU”,
DS_NAME = “Queue_Common_Stats”,
ID = 3,
Number_Entered = 937,
Number_Exited = 933,
Number_Rejected = 0,
Occupancy_Max = 4.0,
Occupancy_Mean = 1.2875467664351,
Occupancy_Min = 0.0,
Occupancy_StDev = 1.019662345381,
Queue_Number = 2,
TIME = 4.797E-6,
Total_Delay_Max = 2.4E-8,
Total_Delay_Mean = 7.6959314775161E-9,
Total_Delay_Min = 0.0,
Total_Delay_StDev = 4.5633354639267E-9}
DISPLAY AT TIME —— 4.79700 us ——
{BLOCK = “Single_vs_Hyper_Thread.Thread_Proc.DU”,
DS_NAME = “Queue_Common_Stats”,
ID = 4,
Number_Entered = 1461,
Number_Exited = 1460,
Number_Rejected = 0,
Occupancy_Max = 3.0,
Occupancy_Mean = 1.1454483230664,
Occupancy_Min = 0.0,
Occupancy_StDev = 0.8378422431869,
Queue_Number = 3,
TIME = 4.797E-6,
Total_Delay_Max = 3.2E-8,
Total_Delay_Mean = 6.4941820670774E-9,
Total_Delay_Min = 0.0,
Total_Delay_StDev = 3.9113377510932E-9}
Ratio of Clock Speeds (GHz): 1.3 GHz / 1.0GHz = 1.3 Ratio Ratio of Threads per Sec : 2.88889E8 / 2.22222E8 = 1.3
4x cycles per mnemonic for instruction mix
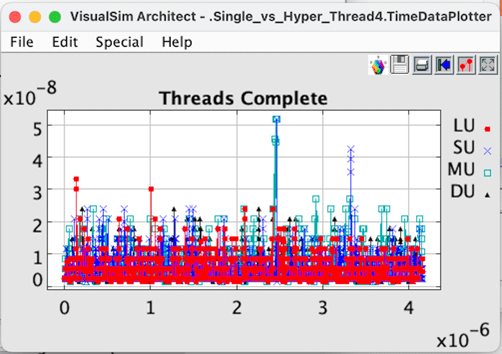 Figure 7 Single Thread per Core completion.
Single Thread per Core, note 0.769 ns per cycle at 1.3 GHz clock rate.
4.0 (cycles per thread) * 0.769 ns (per cycle) * 1200 (threads) + 1ns (offset) = 3.6922 usec, assuming no thread delays.
DISPLAY AT TIME —— 3.71790 us ——
{BLOCK = “Single_vs_Hyper_Thread4.Thread_Proc.LU”,
DS_NAME = “Queue_Common_Stats”,
ID = 1,
Number_Entered = 1632,
Number_Exited = 1627,
Number_Rejected = 0,
Occupancy_Max = 8.0,
Occupancy_Mean = 2.761963190184,
Occupancy_Min = 0.0,
Occupancy_StDev = 1.6374905456181,
Queue_Number = 0,
TIME = 3.7179E-6,
Total_Delay_Max = 2.48E-8,
Total_Delay_Mean = 7.6490786240787E-9,
Total_Delay_Min = 0.0,
Total_Delay_StDev = 2.5287376085864E-9}
DISPLAY AT TIME —— 3.71790 us ——
{BLOCK = “Single_vs_Hyper_Thread4.Thread_Proc.SU”,
DS_NAME = “Queue_Common_Stats”,
ID = 2,
Number_Entered = 805,
Number_Exited = 802,
Number_Rejected = 0,
Occupancy_Max = 10.0,
Occupancy_Mean = 2.43407960199,
Occupancy_Min = 0.0,
Occupancy_StDev = 1.7866650257005,
Queue_Number = 1,
TIME = 3.7179E-6,
Total_Delay_Max = 5.58E-8,
Total_Delay_Mean = 1.3453922789539E-8,
Total_Delay_Min = 0.0,
Total_Delay_StDev = 7.7480206883315E-9}
DISPLAY AT TIME —— 3.71790 us ——
{BLOCK = “Single_vs_Hyper_Thread4.Thread_Proc.MU”,
DS_NAME = “Queue_Common_Stats”,
ID = 3,
Number_Entered = 986,
Number_Exited = 984,
Number_Rejected = 0,
Occupancy_Max = 8.0,
Occupancy_Mean = 2.300862506342,
Occupancy_Min = 0.0,
Occupancy_StDev = 1.62717107572,
Queue_Number = 2,
TIME = 3.7179E-6,
Total_Delay_Max = 2.79E-8,
Total_Delay_Mean = 9.7783756345178E-9,
Total_Delay_Min = 0.0,
Total_Delay_StDev = 4.2992821264787E-9}
DISPLAY AT TIME —— 3.71790 us ——
{BLOCK = “Single_vs_Hyper_Thread4.Thread_Proc.DU”,
DS_NAME = “Queue_Common_Stats”,
ID = 4,
Number_Entered = 1377,
Number_Exited = 1373,
Number_Rejected = 0,
Occupancy_Max = 13.0,
Occupancy_Mean = 2.7128316975645,
Occupancy_Min = 0.0,
Occupancy_StDev = 1.7939209355997,
Queue_Number = 3,
TIME = 3.7179E-6,
Total_Delay_Max = 3.1E-8,
Total_Delay_Mean = 9.629403202329E-9,
Total_Delay_Min = 0.0,
Total_Delay_StDev = 4.1752713576731E-9}
DISPLAY AT TIME —— 3.71790 us ——
Single_Core Threads per Sec: 2.8888888888889E8
Hyper-Thread, note 1 ns per instruction or 1.0 GHz clock rate.
DISPLAY AT TIME —— 4.79700 us ——
Hyper_Thread_Flag Threads per Sec: 2.2222222222222E8
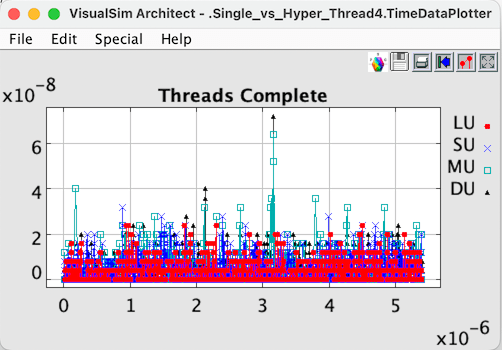 Figure 8 Hyper Thread per Core completion.
DISPLAY AT TIME —— 4.79700 us ——
{BLOCK = “Single_vs_Hyper_Thread4.Thread_Proc.LU”,
DS_NAME = “Queue_Common_Stats”,
ID = 1,
Number_Entered = 1634,
Number_Exited = 1629,
Number_Rejected = 0,
Occupancy_Max = 8.0,
Occupancy_Mean = 1.5220588235294,
Occupancy_Min = 0.0,
Occupancy_StDev = 1.2335202600014,
Queue_Number = 0,
TIME = 4.797E-6,
Total_Delay_Max = 3.2E-8,
Total_Delay_Mean = 6.2085889570554E-9,
Total_Delay_Min = 0.0,
Total_Delay_StDev = 3.3083905002595E-9}
DISPLAY AT TIME —— 4.79700 us ——
{BLOCK = “Single_vs_Hyper_Thread4.Thread_Proc.SU”,
DS_NAME = “Queue_Common_Stats”,
ID = 2,
Number_Entered = 794,
Number_Exited = 791,
Number_Rejected = 0,
Occupancy_Max = 8.0,
Occupancy_Mean = 1.5643127364439,
Occupancy_Min = 0.0,
Occupancy_StDev = 1.3447249002317,
Queue_Number = 1,
TIME = 4.797E-6,
Total_Delay_Max = 7.6E-8,
Total_Delay_Mean = 1.1626262626263E-8,
Total_Delay_Min = 0.0,
Total_Delay_StDev = 8.3763566470453E-9}
DISPLAY AT TIME —— 4.79700 us ——
{BLOCK = “Single_vs_Hyper_Thread4.Thread_Proc.MU”,
DS_NAME = “Queue_Common_Stats”,
ID = 3,
Number_Entered = 905,
Number_Exited = 904,
Number_Rejected = 0,
Occupancy_Max = 7.0,
Occupancy_Mean = 1.439226519337,
Occupancy_Min = 0.0,
Occupancy_StDev = 1.1836396058956,
Queue_Number = 2,
TIME = 4.797E-6,
Total_Delay_Max = 3.2E-8,
Total_Delay_Mean = 8.8132596685084E-9,
Total_Delay_Min = 0.0,
Total_Delay_StDev = 5.6764942184528E-9}
DISPLAY AT TIME —— 4.79700 us ——
{BLOCK = “Single_vs_Hyper_Thread4.Thread_Proc.DU”,
DS_NAME = “Queue_Common_Stats”,
ID = 4,
Number_Entered = 1467,
Number_Exited = 1466,
Number_Rejected = 0,
Occupancy_Max = 8.0,
Occupancy_Mean = 1.7024539877301,
Occupancy_Min = 0.0,
Occupancy_StDev = 1.4112270559476,
Queue_Number = 3,
TIME = 4.797E-6,
Total_Delay_Max = 3.2E-8,
Total_Delay_Mean = 8.3108384458079E-9,
Total_Delay_Min = 0.0,
Total_Delay_StDev = 4.6201492308446E-9}
Ratio of Clock Speeds (GHz): 1.3 GHz / 1.0GHz = 1.3
Ratio of Threads per Sec : 2.88889E8 / 2.22222E8 = 1.3
The single thread core completes 1.3x more threads than a hyper-threaded processor core with the same mix of instructions per thread. The exact performance is dependent on the instruction mix, the number of cycles per mnemonic, and the number of parallel Execution Units (EU). This counters the Intel claim of 15% to 30% improved performance for hyper-threads.
The assertion that the number of cycles per mnemonic may be a factor, the higher number of cycles per mnemonic suggests that these instructions may not be optimized. One area for further investigation might be to model thread execution in more detail. This paper assumes processor is efficient and the EU execution of mnemonics plays the predominate role.
Conclusions
Looking at the two different models with 1x, 4x cycles per instruction, one can observe that thread completion times have similar timing profiles. Based on the simulation results, single thread per core has proven to be slightly faster, and less power than hyper-threading alternatives. The model found that the trade-off between single vs hyper threads must be based on the thread instruction mix. It is important to accurately simulate an instruction mix to confirm the actual design benefits. Even though power has been highlighted, we did not model the exact power domains in this study.
The Hyper-Thread model determined that the bandwidth of the Execution Unit (EU) queue has a greater impact on the thread count per core, rather than wait for EU resources to be available; which the IBM-based Tomasulo algorithm suggests for the original out-of-order algorithms, the Hyper-Thread model just populates the mnemonic into the appropriate EU queue. The EU utilization indicates that this is efficient because MUL and DIV instructions take 2x and 4x cycles per instruction respectively for a thread to complete. The EU queue statistics also show a mean delay that takes into account of cycles beyond four cycles, implies a number of four-plus cycle instruction mnemonics that were needed to complete a thread. On the other hand, if we wait for all resources to be available, according to the original Tomasulo algorithm, before issuing a new mnemonic, a thread will take more cycles and consume more power
Issuing threads as they arrive, assuming the EU queues have space is processing efficient. If an EU queue is full, then an instruction thread needs to be saved in memory, which requires additional logic, power, and additional chip area.
We have speculated as to the real reason for the Hyper-thread, believe that Intel promoted this as an interim solution as to adding more cores, as the die area increased by only 5%. Hyper-threading is no longer considered a viable solution as processors with a larger number of cores are available because of the improved die yields. This makes single-threads cores more efficient, in terms of threads per second completed.