
System level SOC Power Modeling with VisualSim- Part 2
System level SOC Power Modeling with VisualSim- Part 2
In the part 1 of this system-level power modeling series we introduced VisualSim and laid the foundation for the exploration of SoC power architecture.
VisualSim Architect is a system level simulation tool which provides a one stop solution for early system level analysis and design space exploration.
We had demonstrated how the user can model DVFS using a dual-core use case.
In part 2 of this series, we aim to demonstrate how the user can define and simulate a power gating strategy in software.
The below figure shows an ARM based system with both HW architecture and Application layers modeled using VisualSim Architect.
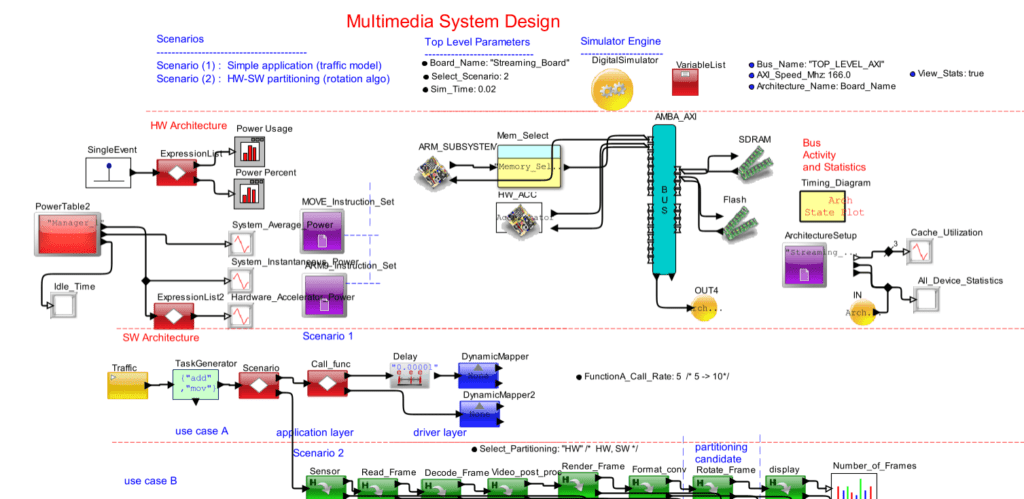
The user can run a set of workloads on the System Model before deciding the power gating strategy.
Let us consider an example workload generated using an instruction mix table (it generates a random sequence of instructions that emulates a software task to be run on the processor).
During the execution, the rotate frame task is either routed to the CPU or the Hardware Accelerator, depending on the requirement.
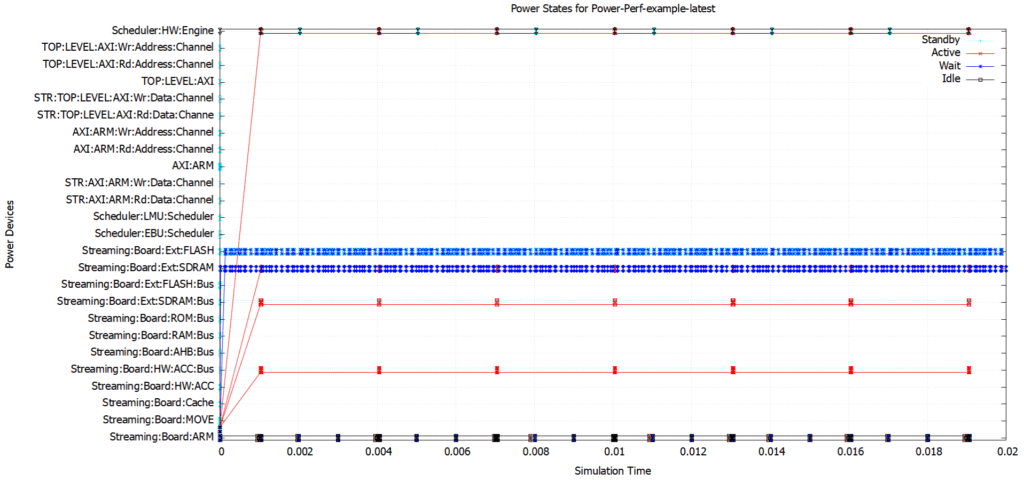
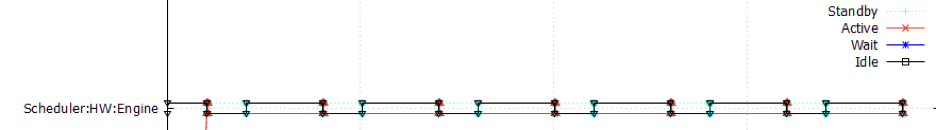
Now, we can observe the activity of the Device when this workload is executed. We have a log file that shows the State transitions. (Fig 2, Fig3) We also have an activity diagram which give a graphical representation (Fig 4).
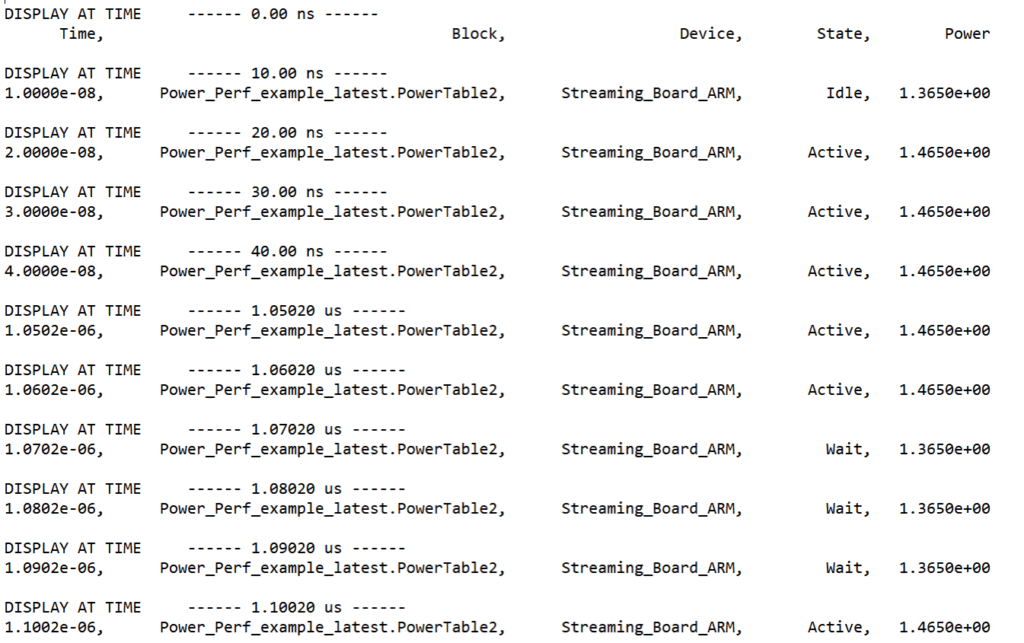
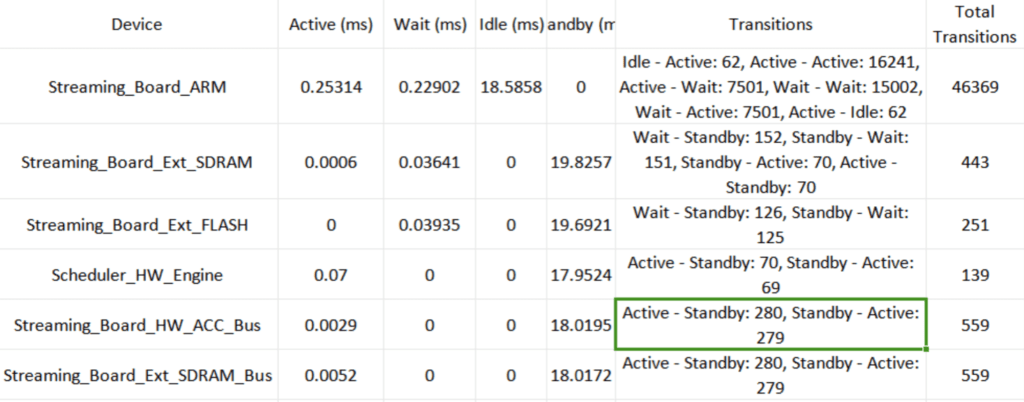
Based on these observations, the user can get a quantitative idea on how often a device is going to transition from a higher activity state to lower activity state. This information can be used as an input while designing power partitioning (allocating power domains for each of the blocks).
Let us consider an example of how the information can be interpreted to make power management decisions:
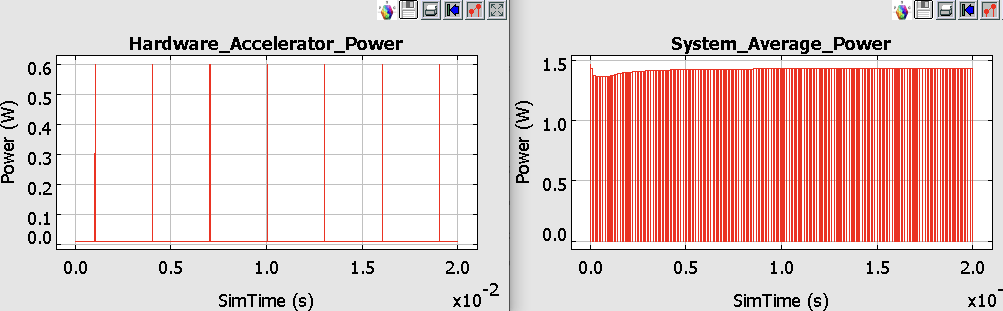
- Hardware Accelerator shows certain periods of inactivity allowing an opportunity to shut down/ power down when not necessary (Fig 5)
- Since the Activity of Other Resources (like CPU) do not completely overlap with the Hardware accelerator, it might be wiser to place it in a separate power domain or in a domain where the devices are not active for a longer duration. This gives an opportunity to optimize power consumption.
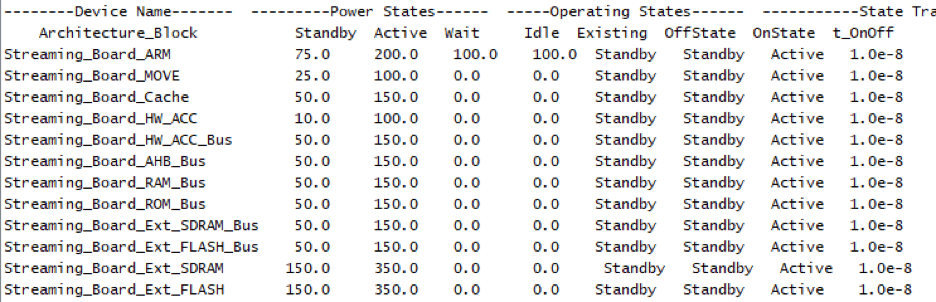
- The wait time before switching the State to a lower activity should be decided based on Transition Delay between the States. This will help in incorporating the Energy Overhead due to switching while making the decision. (t_on_off in Fig 6)
- The transition delay for the accelerator is taken as 10ns. This will be user defined and can include the Voltage regulator delay, time taken for powering up/down the block etc.
- Hence, it would make sense to power gate the block only when the energy overhead due to this delay is lesser than the energy savings due to shutting down the block.
In this case, the hardware accelerator forms a perfect case to be placed in a power gated domain as it has large periods of inactivity. After deciding the strategy, it can be incorporated in the PowerManager block in the model as shown below. We can run the simulation after applying the strategy to observe the impact on power consumption.
Delay_to_Change_State as shown in Fig 7 is used to add the power gating strategy. The time duration after which the block is switched to a lower (or higher) State is given by Time State.
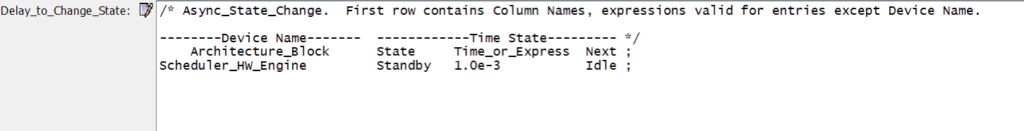
The user can also try trade-offs between switching time and power savings by running simulations.
For Eg : The delay can be changed from 1ms to 1us to observe the difference in power consumption as shown in Fig 8.
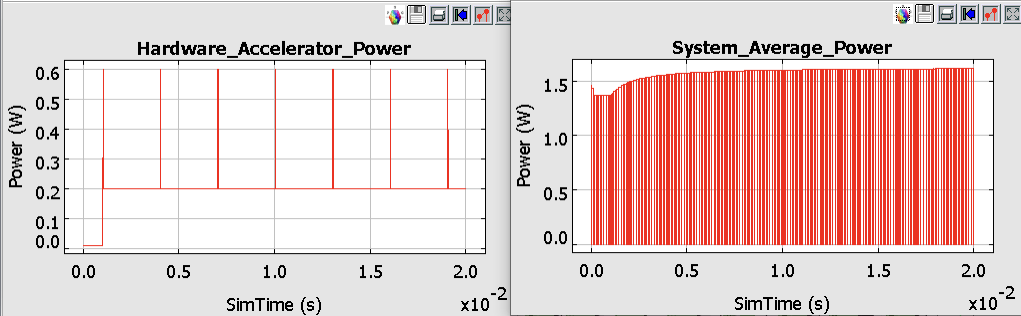
We see that the power consumption reduces when we transition more often. However, the transition overheads should be carefully considered.
This experiment establishes the importance of early system level analysis of complex SOCs. The advantages of performing this analysis at early system level can be summarized as follows –
- By incorporating dynamic aspects of power( power management strategies, effect of workloads) in the system level models, architects can estimate the impact of these strategies on power consumption and performance. This can help in achieving accurate power measurements even at this level (~95%)
- The analysis serves to be valuable as the Pre-RTL level of the design cycle offers maximum (75%) opportunities to reduce power.
- It also enables the companies in meeting time-to-market goals as the simulation times can be significantly reduced (~10x).
In other parts of this series, we will continue exploring other power management options and trade-offs using VisualSim.


