System Level SOC Power Modeling with VisualSim
In the intricate realm of System-on-Chip (SoC) design, optimizing power is paramount. This article series begins by introducing VisualSim, a versatile simulation tool, as a powerful contender in the domain of SoC power modeling and optimization. VisualSim enables system-level SoC power modeling even before delving into the intricacies of Register Transfer Level (RTL) development. In this two-part series, we provide a power modeling methodology with a practical use case showcasing VisualSim’s capabilities while also discussing the drawbacks of alternative approaches. This provides the foundation for understanding the role of VisualSim in SoC power optimization.
Hardware and Software Factors Influencing SoC Power:
Our exploration starts by examining the tangible hardware and software choices that significantly affect SoC power consumption.
These include:
- Use cases
- Architectural details (number of cores, choice of accelerators)
- Power-saving features (DVFS, clock gating, power gating)
- Firmware/software algorithms
- Operating frequency and voltage modes
- Process technology aspects that impact power
Issues in Using Spreadsheets for System-Level Modeling:
The choices made at the system level have the biggest impact on saving power. To figure out
how much power the SoC will use, companies often use spreadsheets. But this method has its
problems. It takes a lot of time, and it’s easy to make mistakes, especially when the SoC is
complex and uses power-saving techniques.
Another issue is that these spreadsheets can’t accurately tell us how software will affect power
usage.
Disadvantages of power simulations at lower abstract levels:
Currently, full-fledged power analysis mostly starts at the RTL level due to concerns about
accuracy at the system level. However, that approach has some disadvantages, such as:
- Limited Time for Design Exploration: RTL/Gate level power simulations consumes time, leaving limited opportunities for exploring design alternatives and optimizations.
- Higher Simulation Time: RTL-based verification often results in longer simulation times, which can slow down the design process and hinder efficient power optimization efforts.
- Increasing SoC Complexity: Sometimes, complexity makes it challenging to power simulations at the RTL level.
Challenges with Machine Learning Models:
ML models, although potent, are data-intensive. They require extensive data for training and may not be scalable across multiple cores. The process of collecting such data is often time-consuming and, at times, not practically feasible. The above factors underscore the need for an accurate system-level power modeling methodology.
Our Methodology
VisualSim allows us to model an SOC at 3 abstract levels:
- Stochastic
- Hybrid
- Cycle accurate
In the first demo model, we intend to use the stochastic approach where the processor cores are modeled as resources. The flow works as below:
- A sample use case is modeled whose parameters can be varied (Eg : Frame Rate, Bit Rate, Resolution)
- Each function in the use case is mapped to a SystemResource (Eg: CPU, DSP, memory as a shared resource).
- We observe the power consumption on the system resources when the parameters are varied.
- The PowerTable in the model supports different PowerStates for these resources (Eg: Idle, wait, active)
- The relationship between power, voltage and frequency can be obtained by characterization of the cores using the data available with the user. (Eg: P = CV^2f)
- The power values will be different for each of these PowerStates (Eg: Idle state could have leakage and clock tree power, active state could have leakage and dynamic power)
- The variation in voltage and frequency due to DVFS and other power saving techniques is modeled by using a simplistic algorithm that tracks the resource utilization and decides the operating point (V & f)
- Additional user data about the real time application can be incorporated. In this case, we have incorporated a sample PTPX data having %time spent by the application on each of the SystemResource
- The change in application parameters like resolution, frame rate etc will impact the time app spends on the resources and hence it changes power consumption
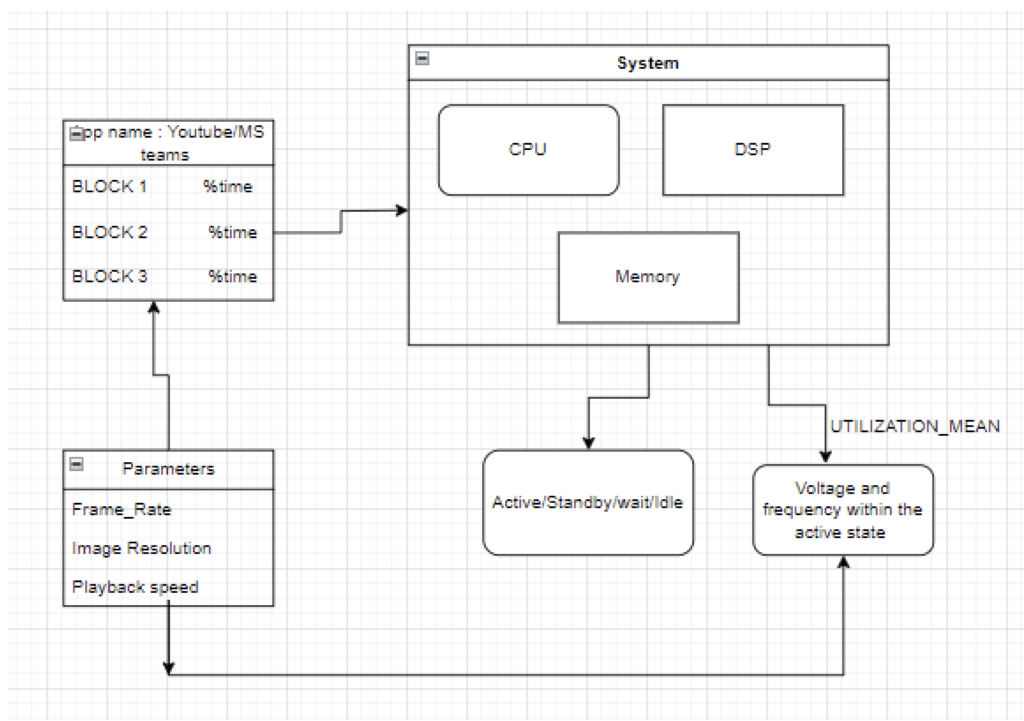
Fig 1 : Block Diagram showing a sample use case
Although the use case presented adopts a rudimentary approach, it aims to establish the
extensibility of this approach to more realistic applications. The system can also be accurately
modeled to replicate a full SOC by including other components like cache, buses etc.
Fine tuning the model:
These are the possible ways to incorporate the data from user teams:
- PTPX[2] data – if the user has %time or %power data for a limited number of applications, it can be taken as input in the model and can be scaled according to the variations in application parameters.
- Characterization curves/equations[1] – this information can be used to define the relationship between power and other device parameters like voltage, frequency, temperature etc
- Average gate level activity – this can be used as a scaling factor in the dynamic power
equation defined for the cores. - UPF format – The information in the UPF can be modeled on VisualSim using theavailable infrastructure like PowerTable, PowerStates etc
Validation:
If the user has real power measurement data for a limited set of test cases, we can use the same to compare the simulation results and calculate the %error and standard deviation. Thus, the tool plays a significant role in providing an environment for simulation. It helps the user in achieving tradeoffs and taking power management decisions by varying the application parameters and observing their impact on power consumption.
The presented methodology aims to address two major issues in the system level power modeling – lack of a commercial simulation tool and lower accuracy. It tries to address the accuracy issues by giving an option to incorporate some user information from lower abstraction levels.[1]
In Part 1 of our series, we’ve introduced VisualSim and laid the foundation for our exploration into SoC power optimization.
Join us in the upcoming webinar where we’ll delve into the critical aspects of power optimization, covering everything from estimation to testing and trade-offs. Don’t miss this opportunity to gain valuable insights and strategies for enhancing your SoC power efficiency.
Visit: https://www.mirabilisdesign.com/crack-the-power-code