
The purpose of this model is to implement a system where the tasks of each block are dependent on time. We plot latency and obtain statistics report and use that data to analyse the model. The following sections will tell you about the functionality of this model.
RIO model description:
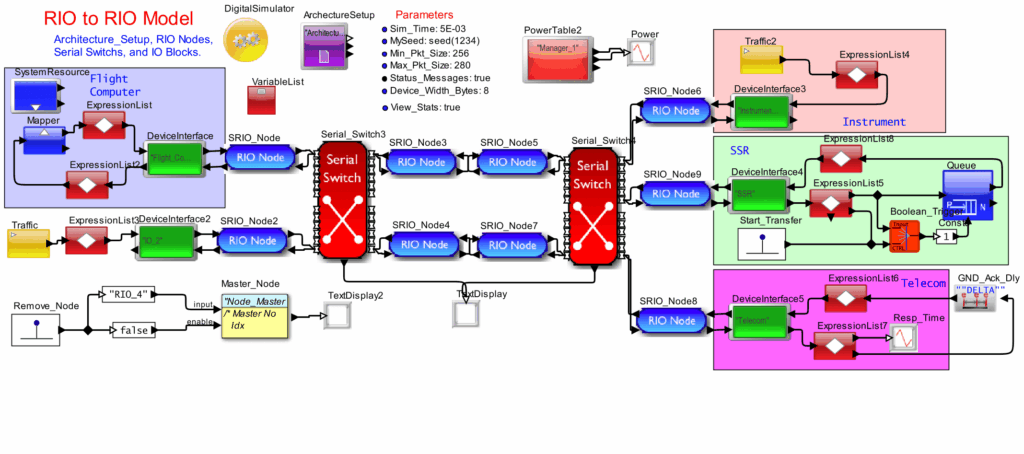
Here we are using 6 RIO switches. Two of those switches are provided outside and the rest are within the CB blocks. We have also implemented an “I_Block” and an “O_Block”. The important block which dictates all the operation in this model is the “Clk_Block”. The “Clk_Block” is designed to generate a clock having a half cycle of 0.5 milliseconds. During this 0.5 milliseconds, the clock block will generate 20 interrupts.
During positive half cycle:
During positive half cycle 20 interrupts are generated and this interrupts are used to generate traffic according to the ACQ payload specified. ACQ payload can be varied by changing the value of the parameter ACQ_Bytes provided in the main Block Diagram Editor window. Now this traffic is passed through the RIO “switch6” and then it passes through the two switches, RIO “switch4” and RIO “switch3” which is present inside the CB02 block and then the data passes through the RIO “switch5” present outside and reaches the “I_Block”. In “I_Block” as the 20 interrupts come one by one, each will trigger a traffic after going through a delay of 50 nanoseconds and is send to the PPC block called MPC which is present in the CB01 block. This input which is generated at the “I_Block” is given as an input to the PPC and the generated output is stored in a queue.
During negative half cycle:
During negative half cycle 20 interrupts are again generated and this interrupts are used to generate traffic according to the ACT payload specified. ACT payload can be varied by changing the value of the parameter ACT_Bytes provided in the main Block Diagram Editor window. Now this traffic is passed through the RIO “switch6” and then it passes through the two switches, RIO “switch4” and RIO “switch3” which is present inside the CB02 block and then the data passes to the RIO switches, “switch2” and “switch” present in the CB01 block. There we provide a mechanism to pop the queue whenever an interrupt comes. These 20 interrupts are passed through a delay of 50 nanoseconds before performing pop. Then the data obtained from the output of queue is send to the “O_Block” via RIO switches,”switch”,”switch2″,”switch3″ and “switch5”.
The graph plotted on the right is the Latency of each task. From the graph, we are able to identify the ripples and can use this data while implementing for obtaining better performance. From the statistics report we are able to obtain various details regards the data rate, maximum occupancy, Standard deviation, Payload , whether any packets were dropped etc.
For modelling this model, I have used the tool VisualSim Architect. It provides the user with a large library and offers the user with various ideas for modelling. The evaluation is pretty fast so we are able to obtain the results on the go.


